
What’s new in iObeya 4.16 – On-premises Version?
Disclaimer 📢
This on-prem version combines the new features and bug fixes that were already available for iObeya Cloud versions 4.13, 4.14, 4.15 and 4.16. However, some additional improvements or bug fixes may have been added to the list to make this version certified for on-prem deployments.
General features
Increase to 25 characters the Value field available in both Standard and Activity cards
Ability for room admins to archive rooms
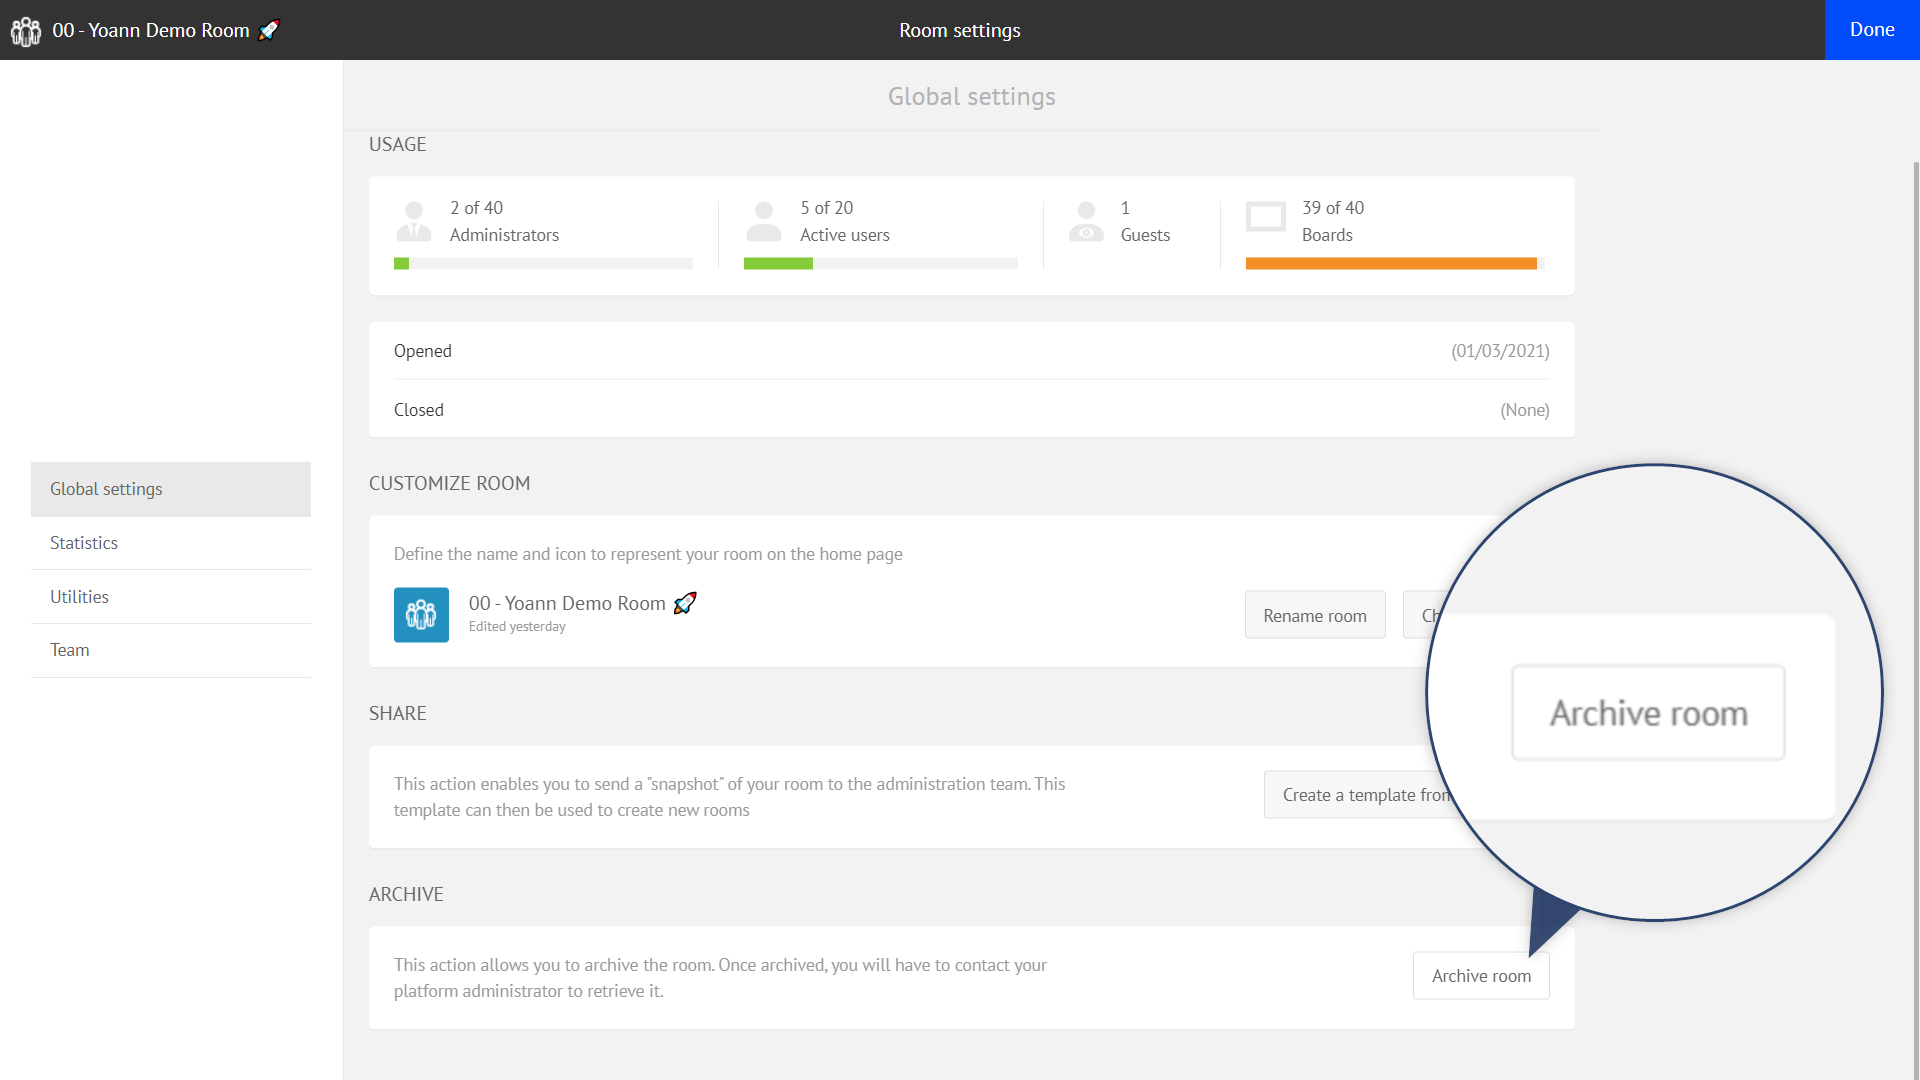
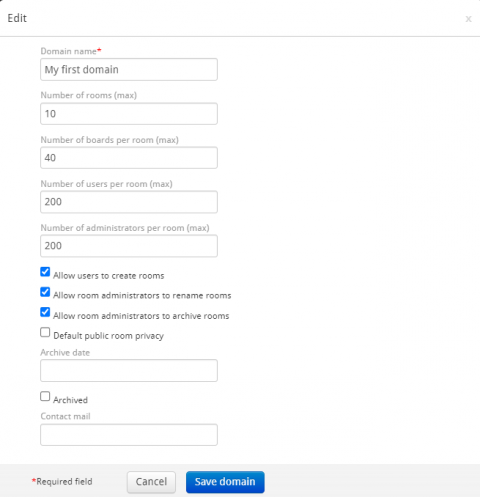
Therefore, you can still create a dedicated domain on your platform with a limited number of licenses so that your teams can use iObeya in complete autonomy. It’s up to you to decide if you want to keep control over license consumption or if you prefer to give that responsibility to Lean-Agile managers so they can benefit from unused licenses on your platform.
Import board: drag-and-drop
The ability to download a board from an iObeya room, and to upload it later in another room, may be very useful, for example, to make a backup of a board including all its parts (elements, background image, dock tools, etc.), or to make an independent copy of the board in another room.
When it comes to uploading a board in a room that was previously downloaded as a ZIP file on your computer, the procedure you may already know is the following: in the room edition mode (for room admins only), first, place the board icon from the “import” tool; then, choose the ZIP file in a filebrowser.
Now there is an alternative way to do this! => In the room edition mode, simply drag and drop the ZIP file on the grid: the board will be added there!
New Button element added in iObeya
It has been some time since we last introduced a new tool in iObeya. While we provide all the tools necessary to support various Visual Management practices, we have observed a growing need to access external resources and content during meetings with iObeya.
Often, users add a dedicated board element such as a Note or Freetext to share a hyperlink and provide a shortcut to external content in iObeya. However, the small blue hyperlink icon displayed at the bottom-right corner may not always be easy to see and click on.
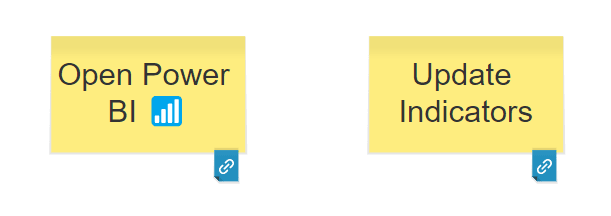
The new button tool added in iObeya 4.16 allows you to add interactive elements to provide quick access to external information or call-to-action on your boards. The button tool is fully customizable. You can change the label of the button, the text color, the background color, and the border color.
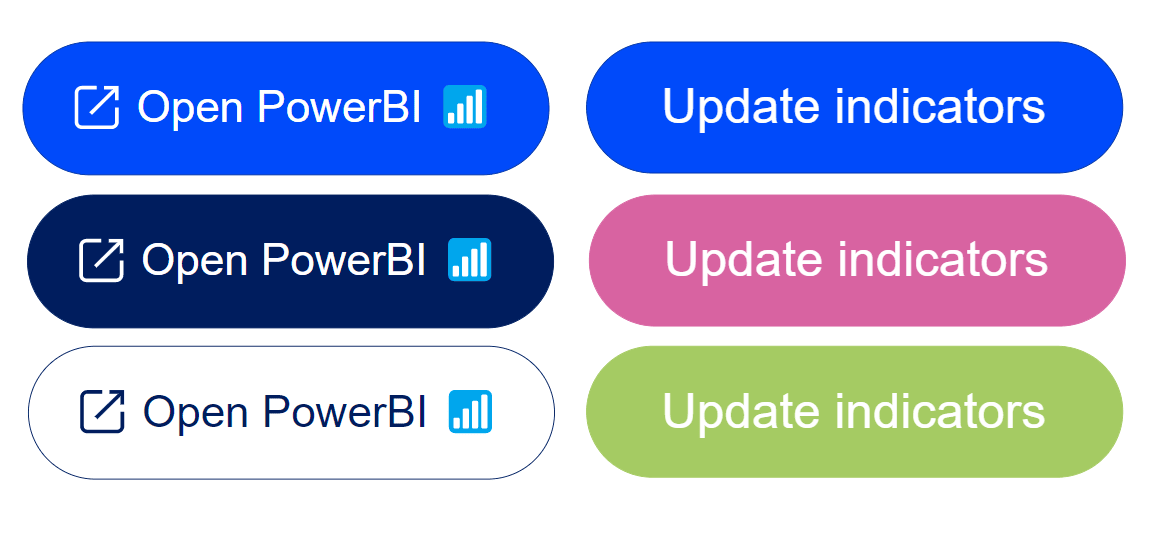
Buttons can be freely resized to easily adapt to the layout and the content of your boards.
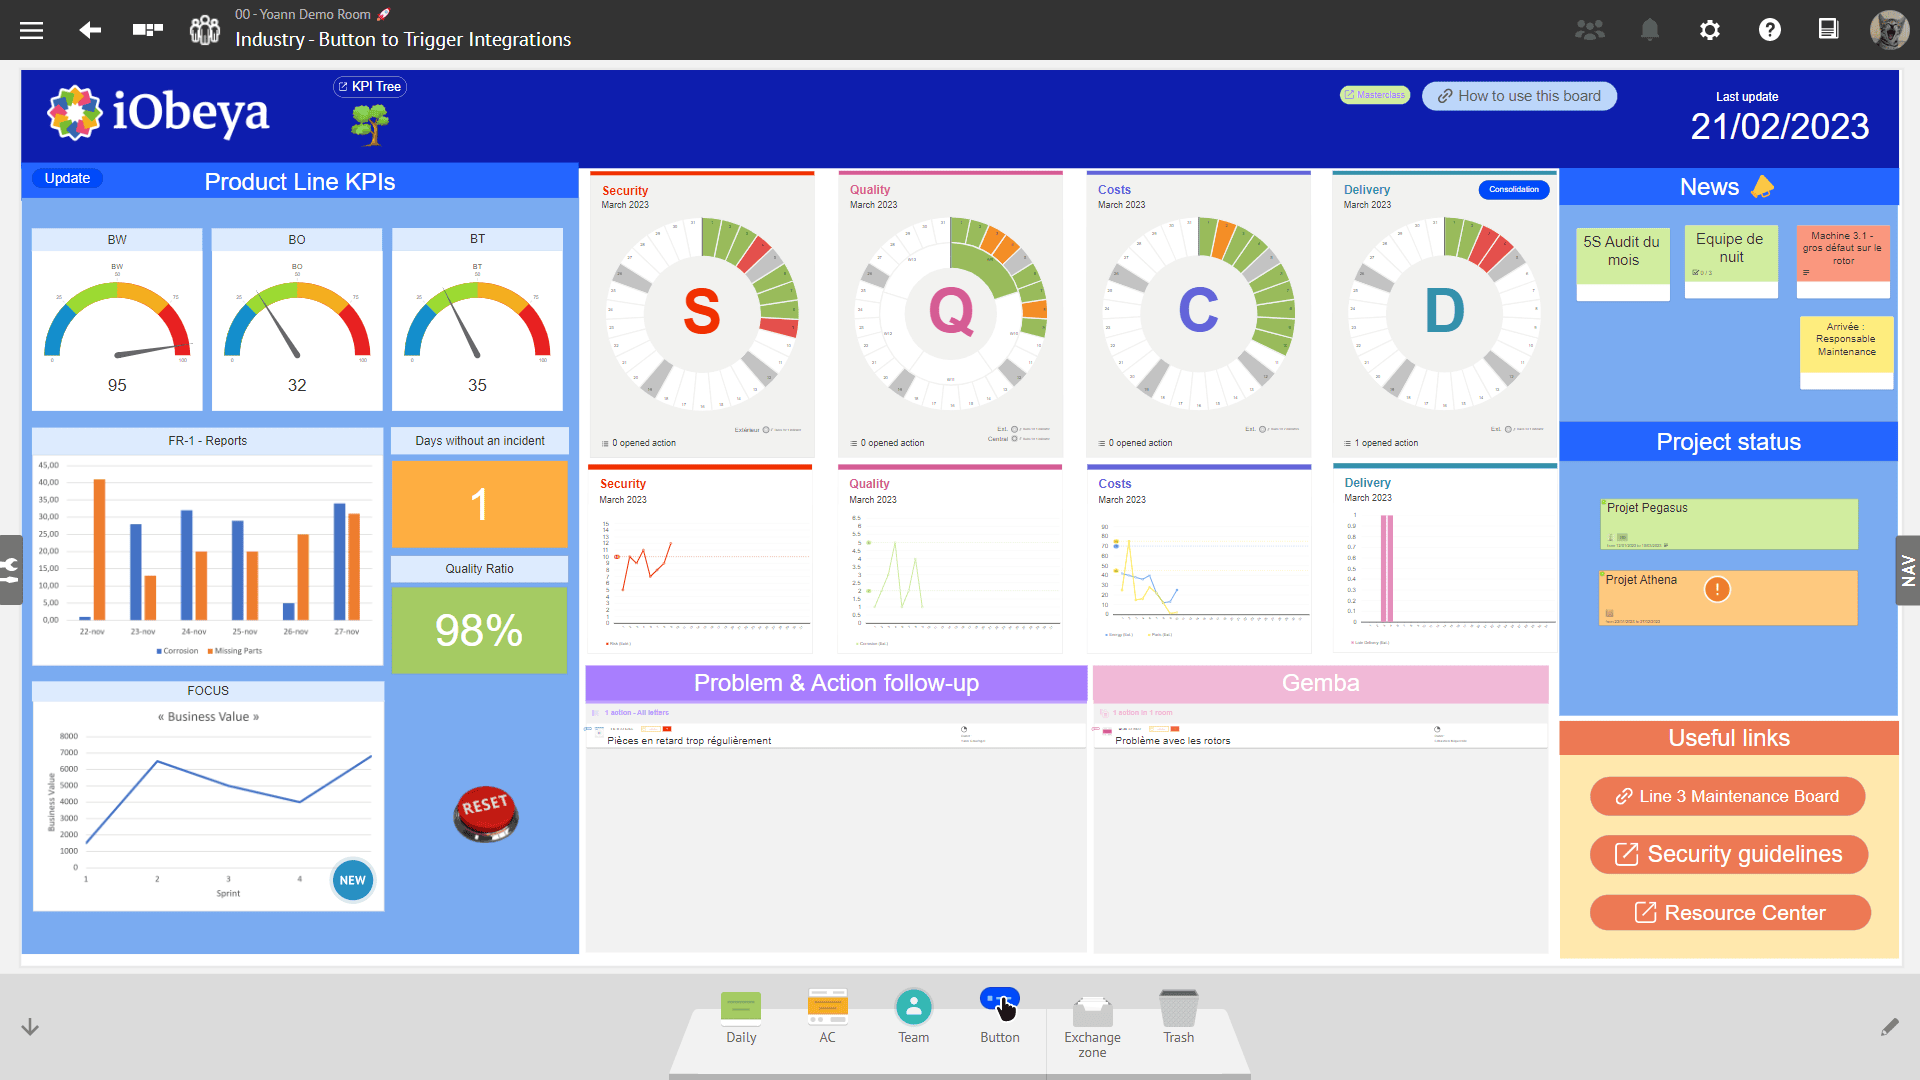
The button offers advanced options that can be used to trigger integration scenarios by providing information from iObeya to allow data context binding with external applications. For instance, you can use a button to trigger an automation flow that will update QCD indicators, thanks to our connector available on the Microsoft Power Platform.
Operational Excellence
QCD add-on (Enterprise plan)
This is an add-on that need to be installed and activated on your iObeya platform. If you can’t find it, you need to request to your platform administrator to install this add-on.
Display indicator values on QCD charts
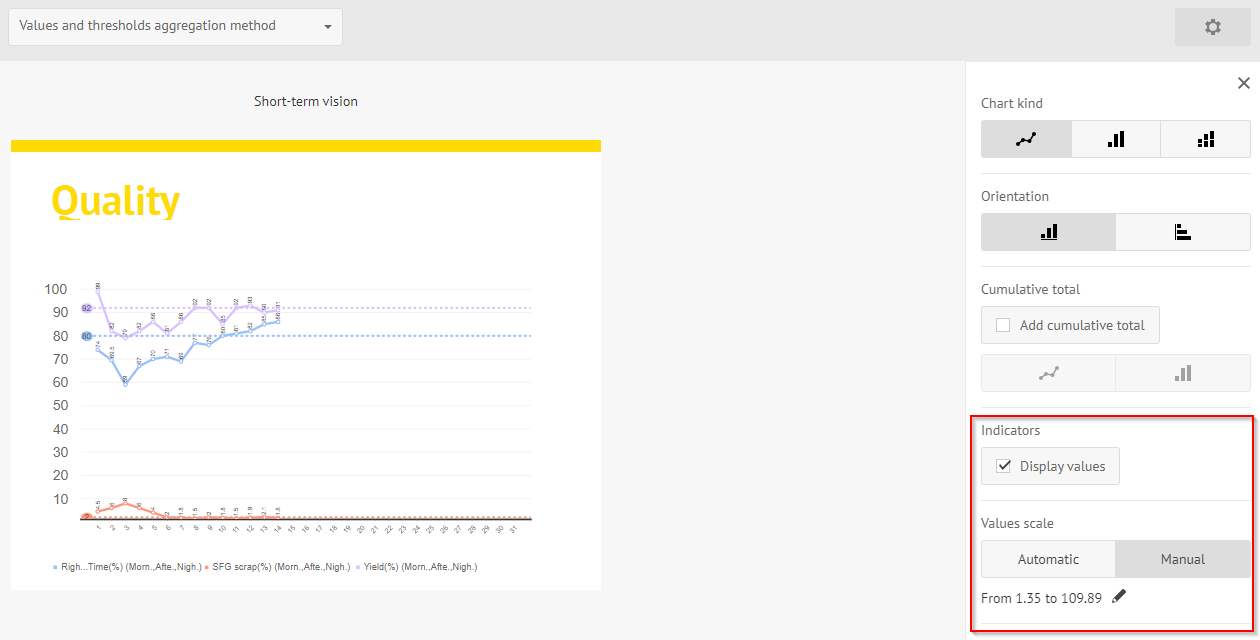
Bringing more Precision to Chart Axes
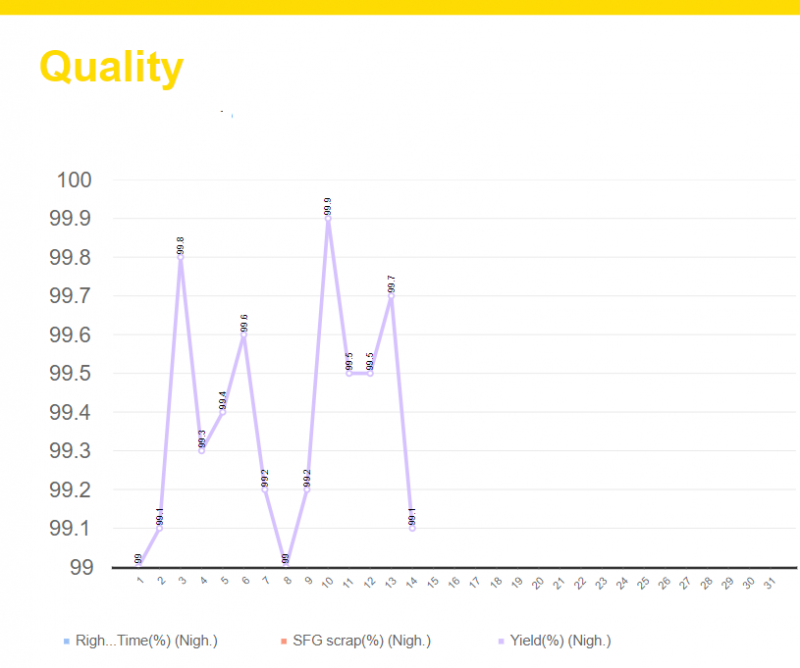
We have also increased the number of graduations between your scale values on the Y axis so that even the smallest difference between indicator values can be visualized, for instance looking if your “Right First Time” indicators are closer to 99% or 100%
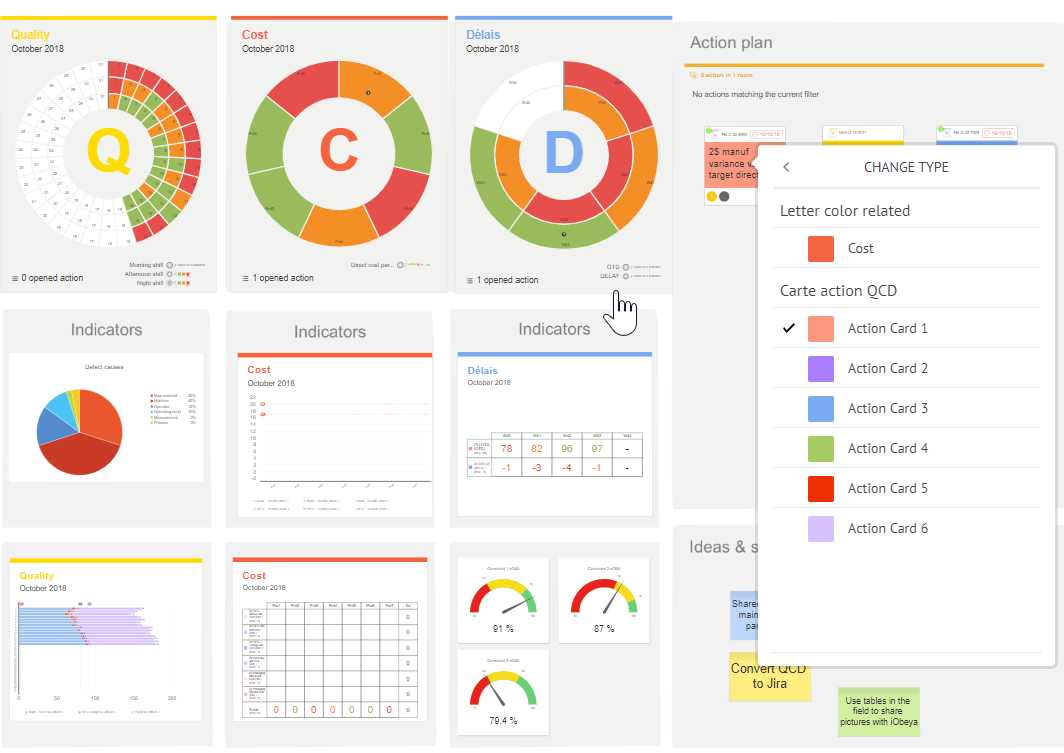
Ability to change the color of a QCD Card
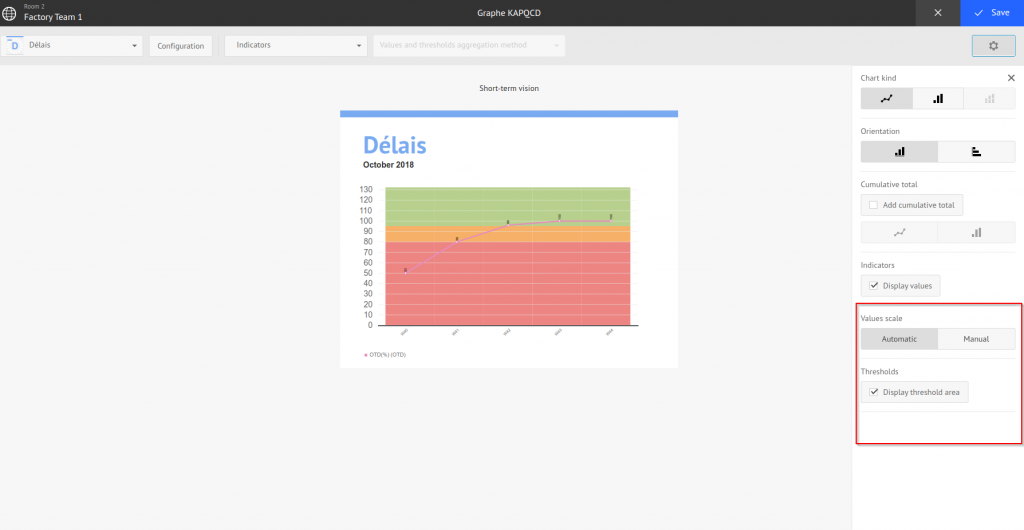
Display indicator's thresholds as background colors red/orange/green in QCD Graphs
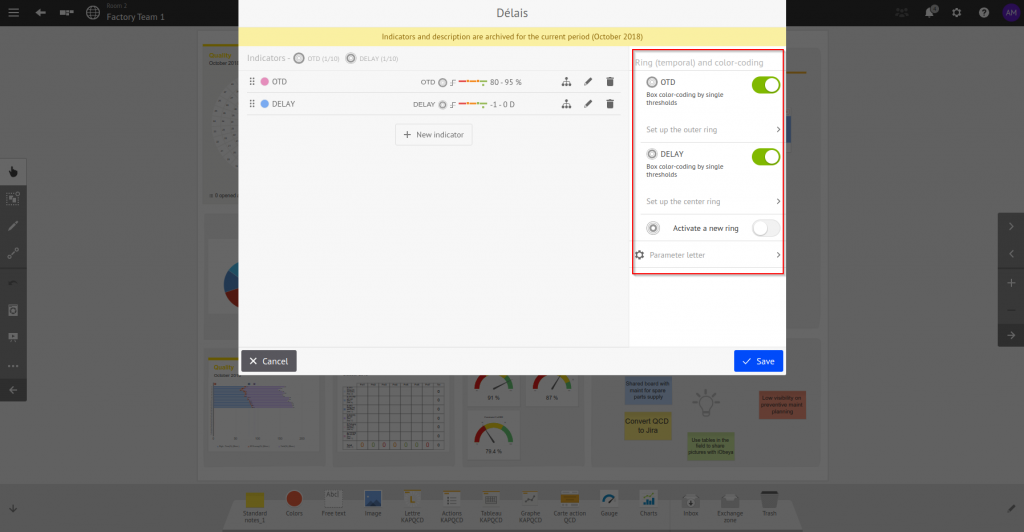
Ability to Display/Hide the Circles on a QCD letter
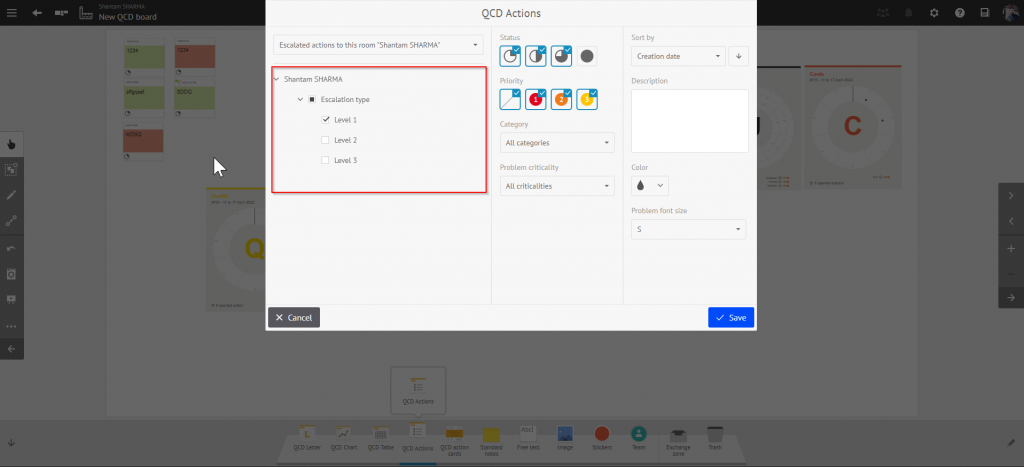
Filter the escalation level in action tables mode 2 “ See actions escalated to this room”
Create a Synchronized card on a board from the escalated actions view and the room view
It was always possible to create a synchronized card on a board when accessing actions from the board view.
In iObeya 4.16 we have improved the way you can share information by adding the ability to create synchronized cards from the escalated actions view and the room action plan.
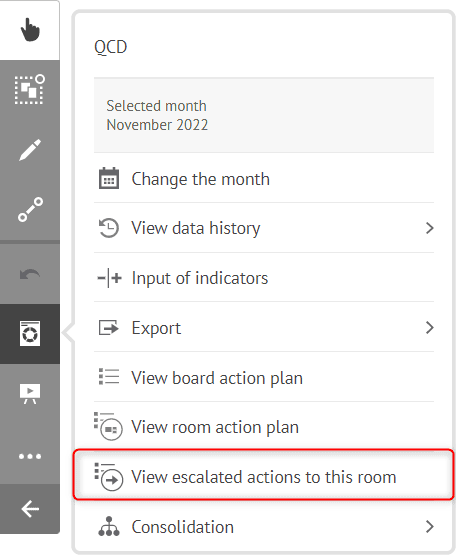
So, how to do this? First, go into the escalated actions from a board or room view from the QCD utility menu.
Click on the “create synchronized card” icon to open a drop down list which will enable you to select the board on which you want to create this synchronized card, and the associated card will appear on the selected board.
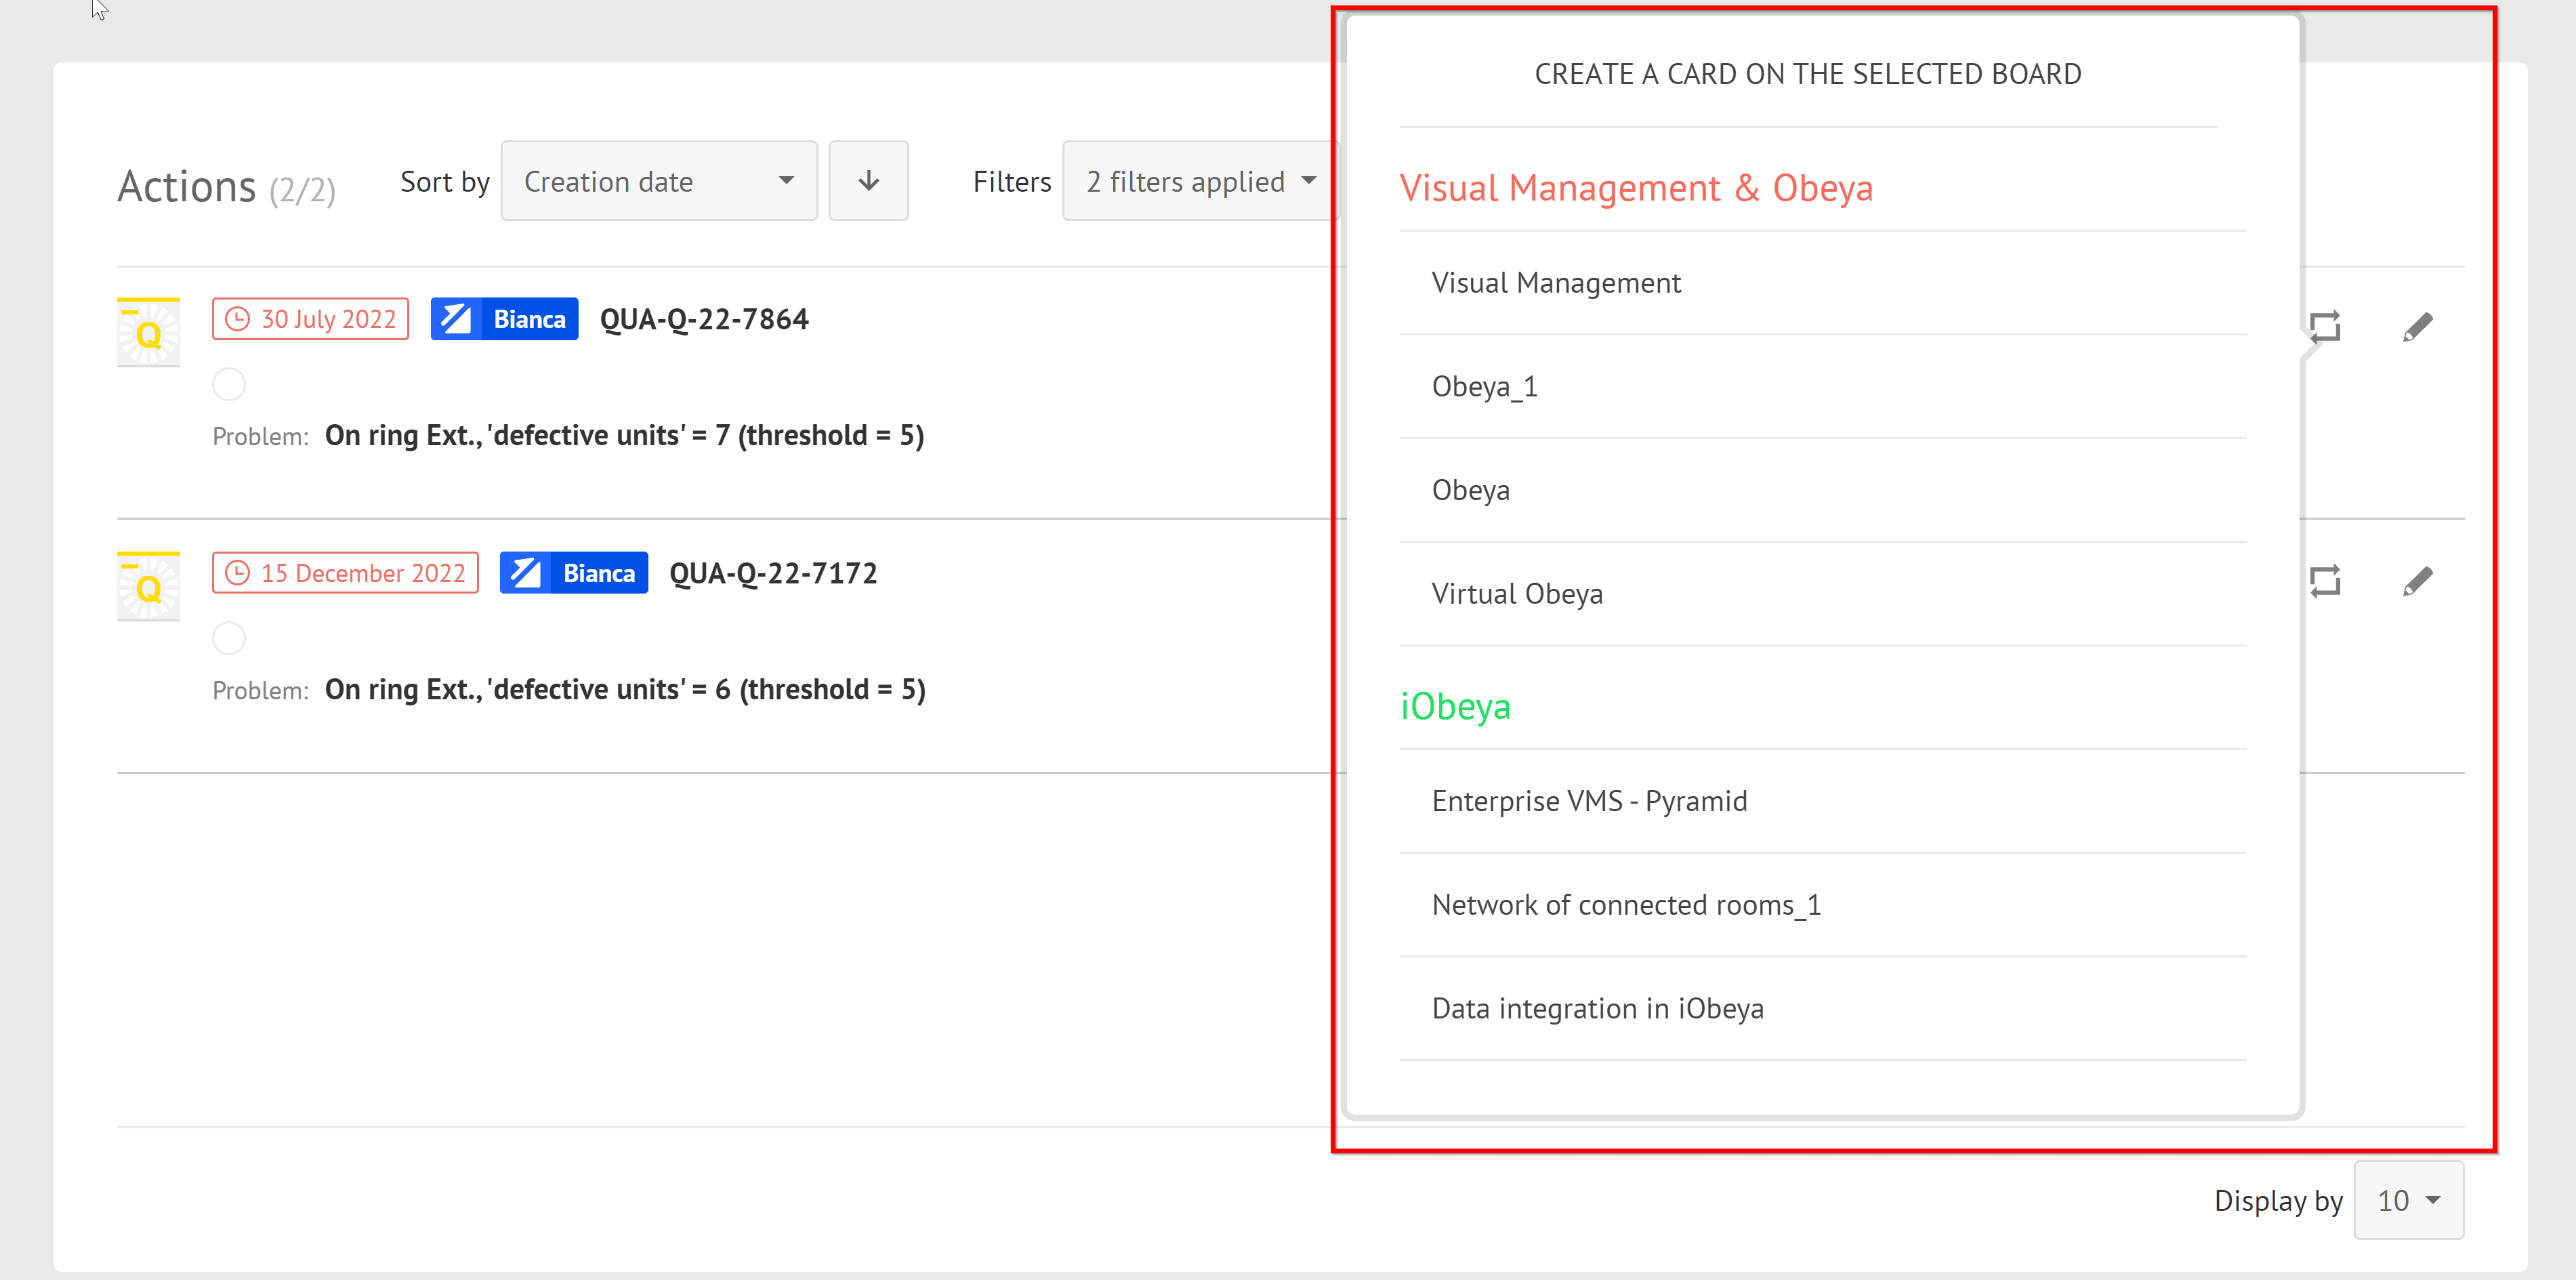
It is important to note that this functionality will only work for actions attached to a letter. However, once created, these synchronized cards can be sent to any board in iObeya, whether QCD or not. This enables transverse sharing of information and will improve problem solving across your organization.
Improvement of escalation icons when an action is escalated or has a response
In this version 4.16 of iObeya we felt the need to improve the visualization of an escalated action vs. an action that got a response. For this, you will have dedicated icons to distinguish an escalated action waiting for a response from an action that has a response.
- If the action is escalated in your action plans, you will see a blue icon with an upward pointing arrow and the escalation level name signifying that the action has been escalated.
- When an escalated action has been responded to, the icon will turn green with a downward pointing arrow.
With these colors and arrows, you will be able to distinguish the two states of an action card more visually and easily.
New search bar in consolidation configuration window
You can set up various QCD dashboards with different indicators. All the different indicators in these QCD boards can then be consolidated at different levels of your organization, thereby creating a KPI tree unique to your organization.
As our clients keep adding new rooms and QCD boards for new production sites, the incoming information for consolidation keeps on increasing. This scaling up of QCD brought up a pain point for these clients, as it takes some time to scroll through all your rooms and boards, find the correct one and then choose the indicator to be added to your consolidation formulas.
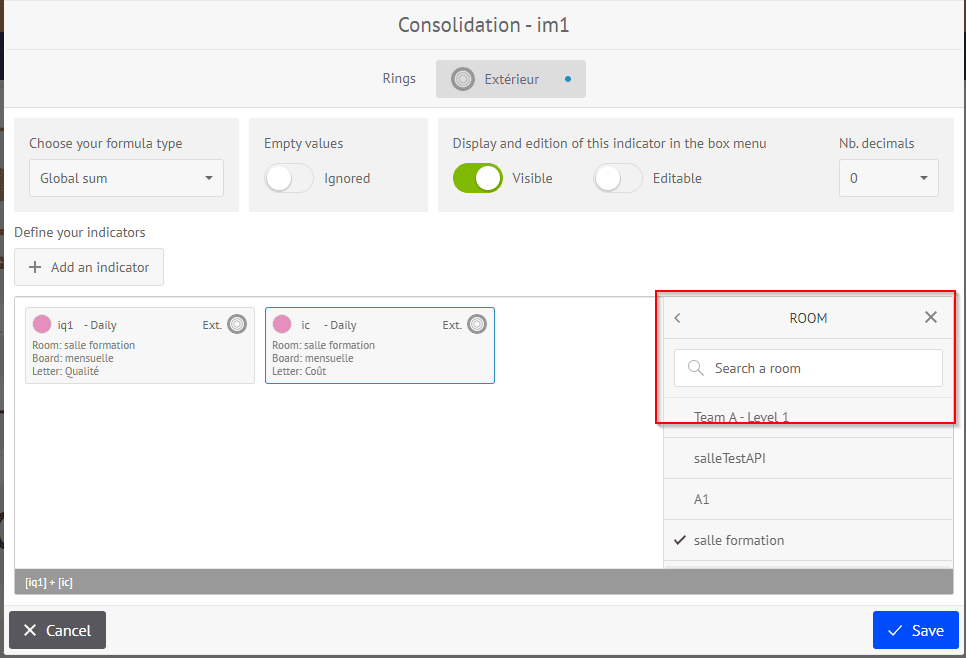
We found this to be quite inefficient and, to give our users a better and fluid experience, we have added a search bar for both rooms and boards so that you can search the indicators in your KPI tree faster while setting up consolidation in your boards.
With these small step by step improvements in each version we hope to remove usability friction and make using QCD in iObeya easier and a pleasure for our QCD users.
Performance and Scalability
We continuously strive to improve the performance and scalability of the iObeya platform. With iObeya 4.15 in our QCD module we have worked on optimizing the execution time for consolidation operations. The difference today is that we have been able to reduce this execution time by 30%. In simpler words if the original operation took 10 seconds to perform we have brought this down to 7 seconds. In upcoming versions we will continue optimizing our QCD module to give our users the best performance experience.
Agile@Scale
Reminder ☝
These are add-ons that need to be installed and activated on your iObeya platform. If you can’t find the corresponding feature, you need to request to your platform administrator to activate the Agile add-on, Jira connector and/or the Azure DevOps connector.
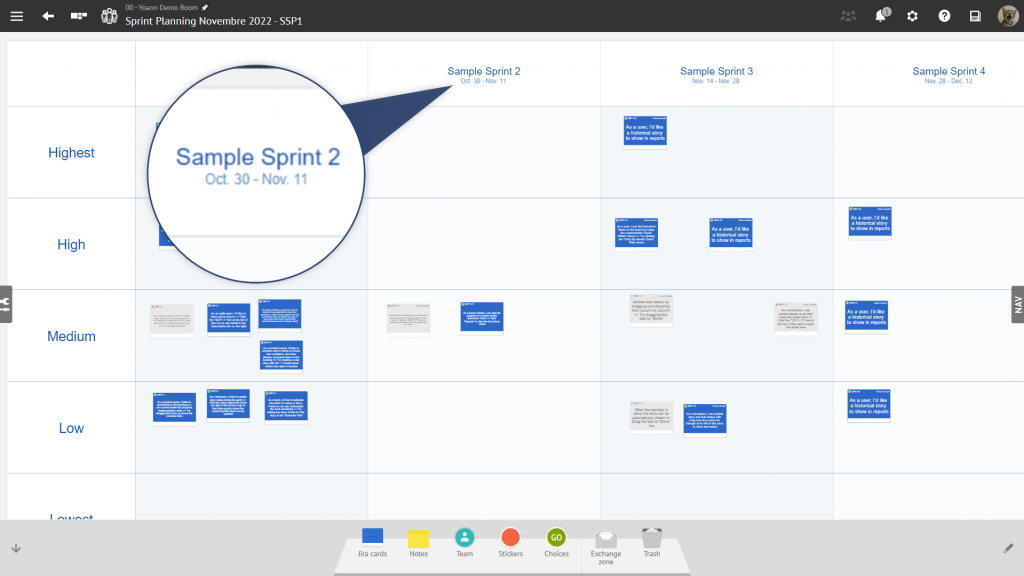
Display the sprint dates automatically in the tables for ADO and Jira connectors
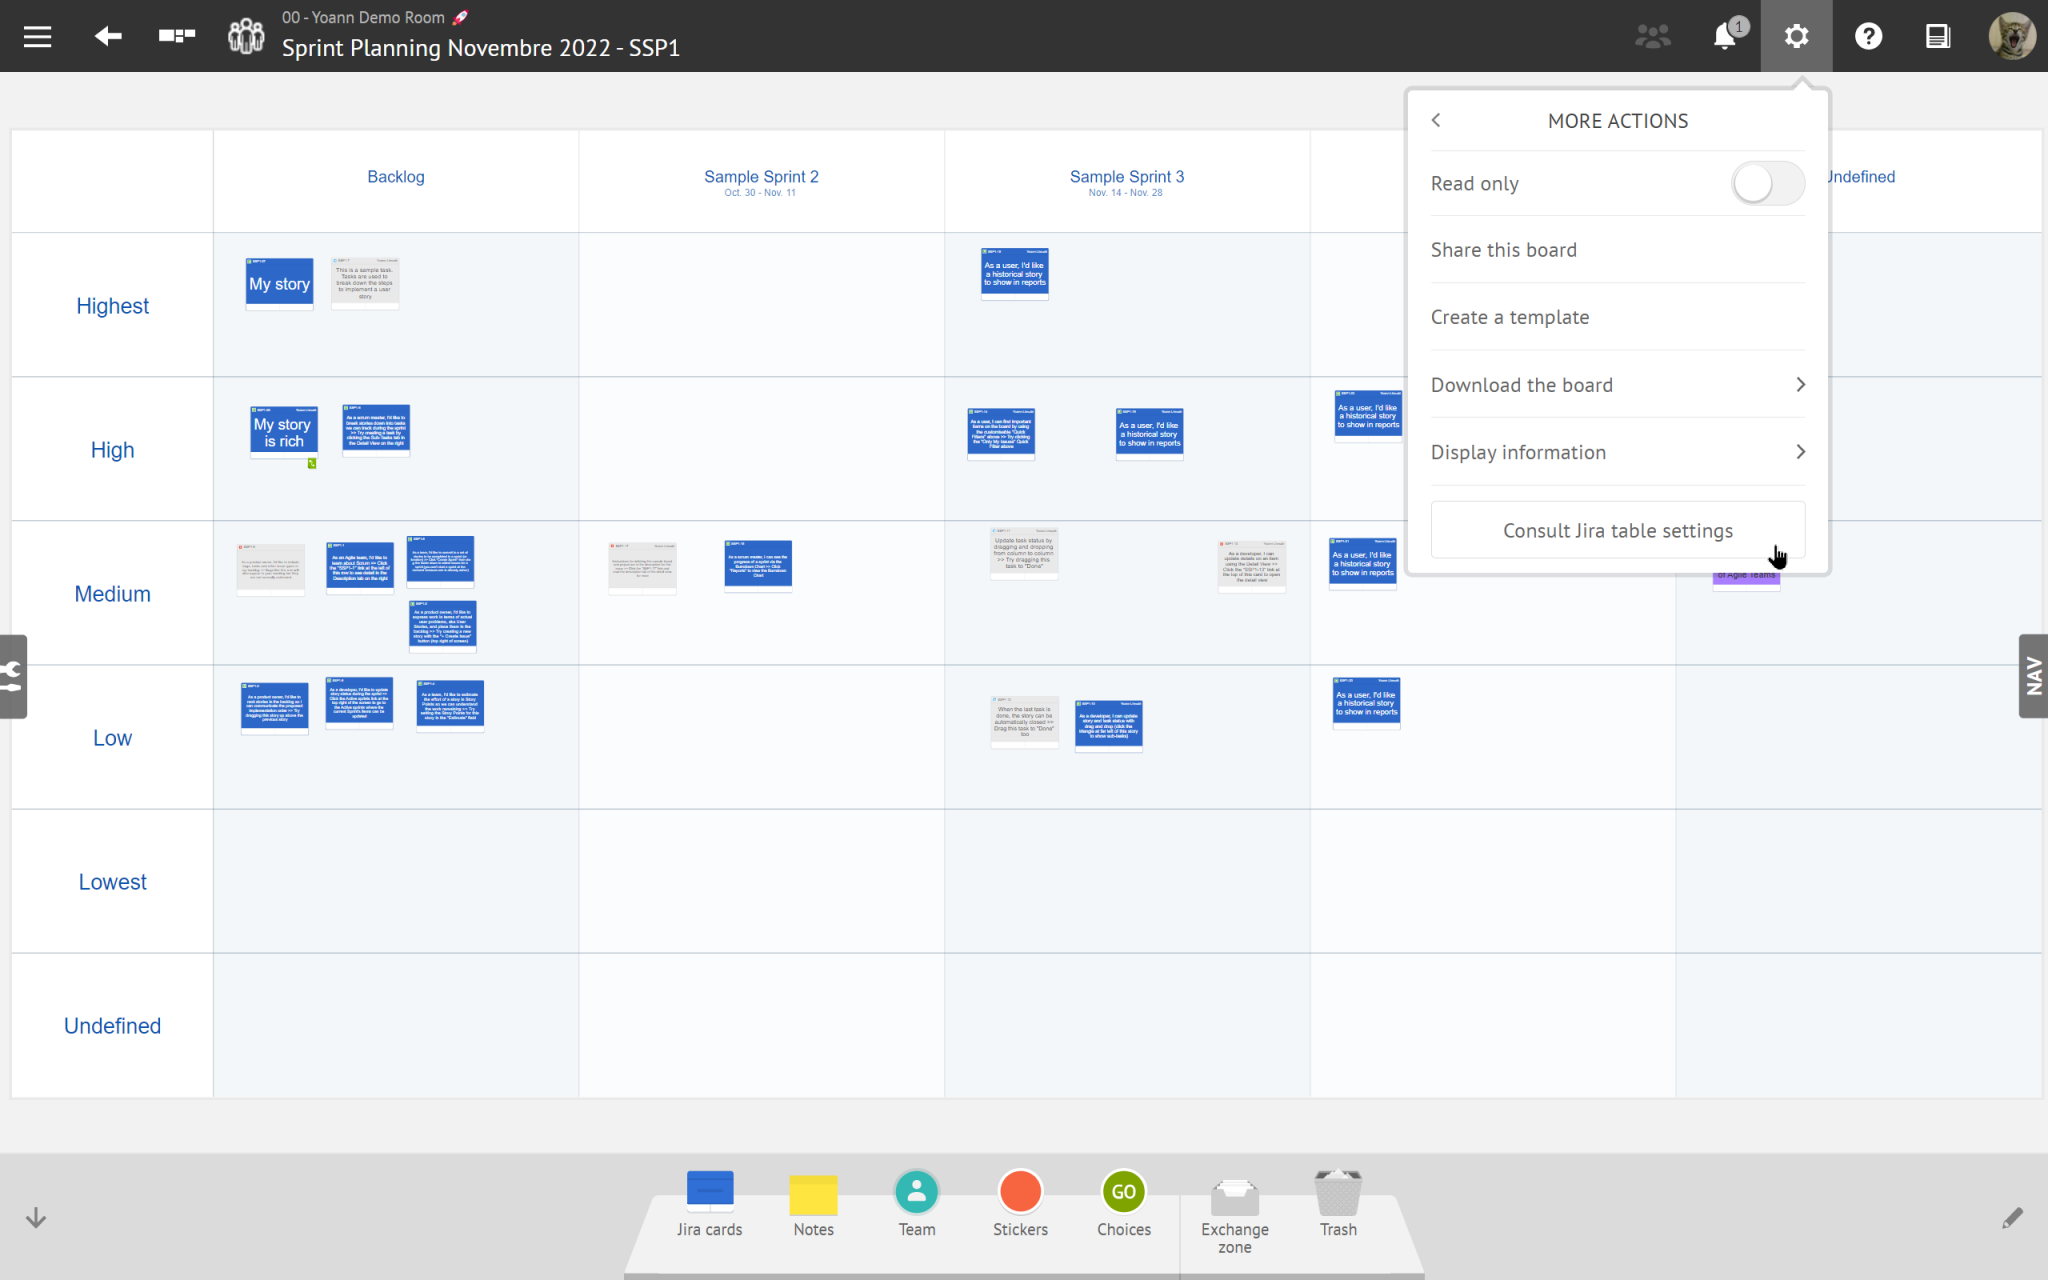
Being able to display in read-only mode the configuration of a Jira board
Compatibility with Jira 9.x

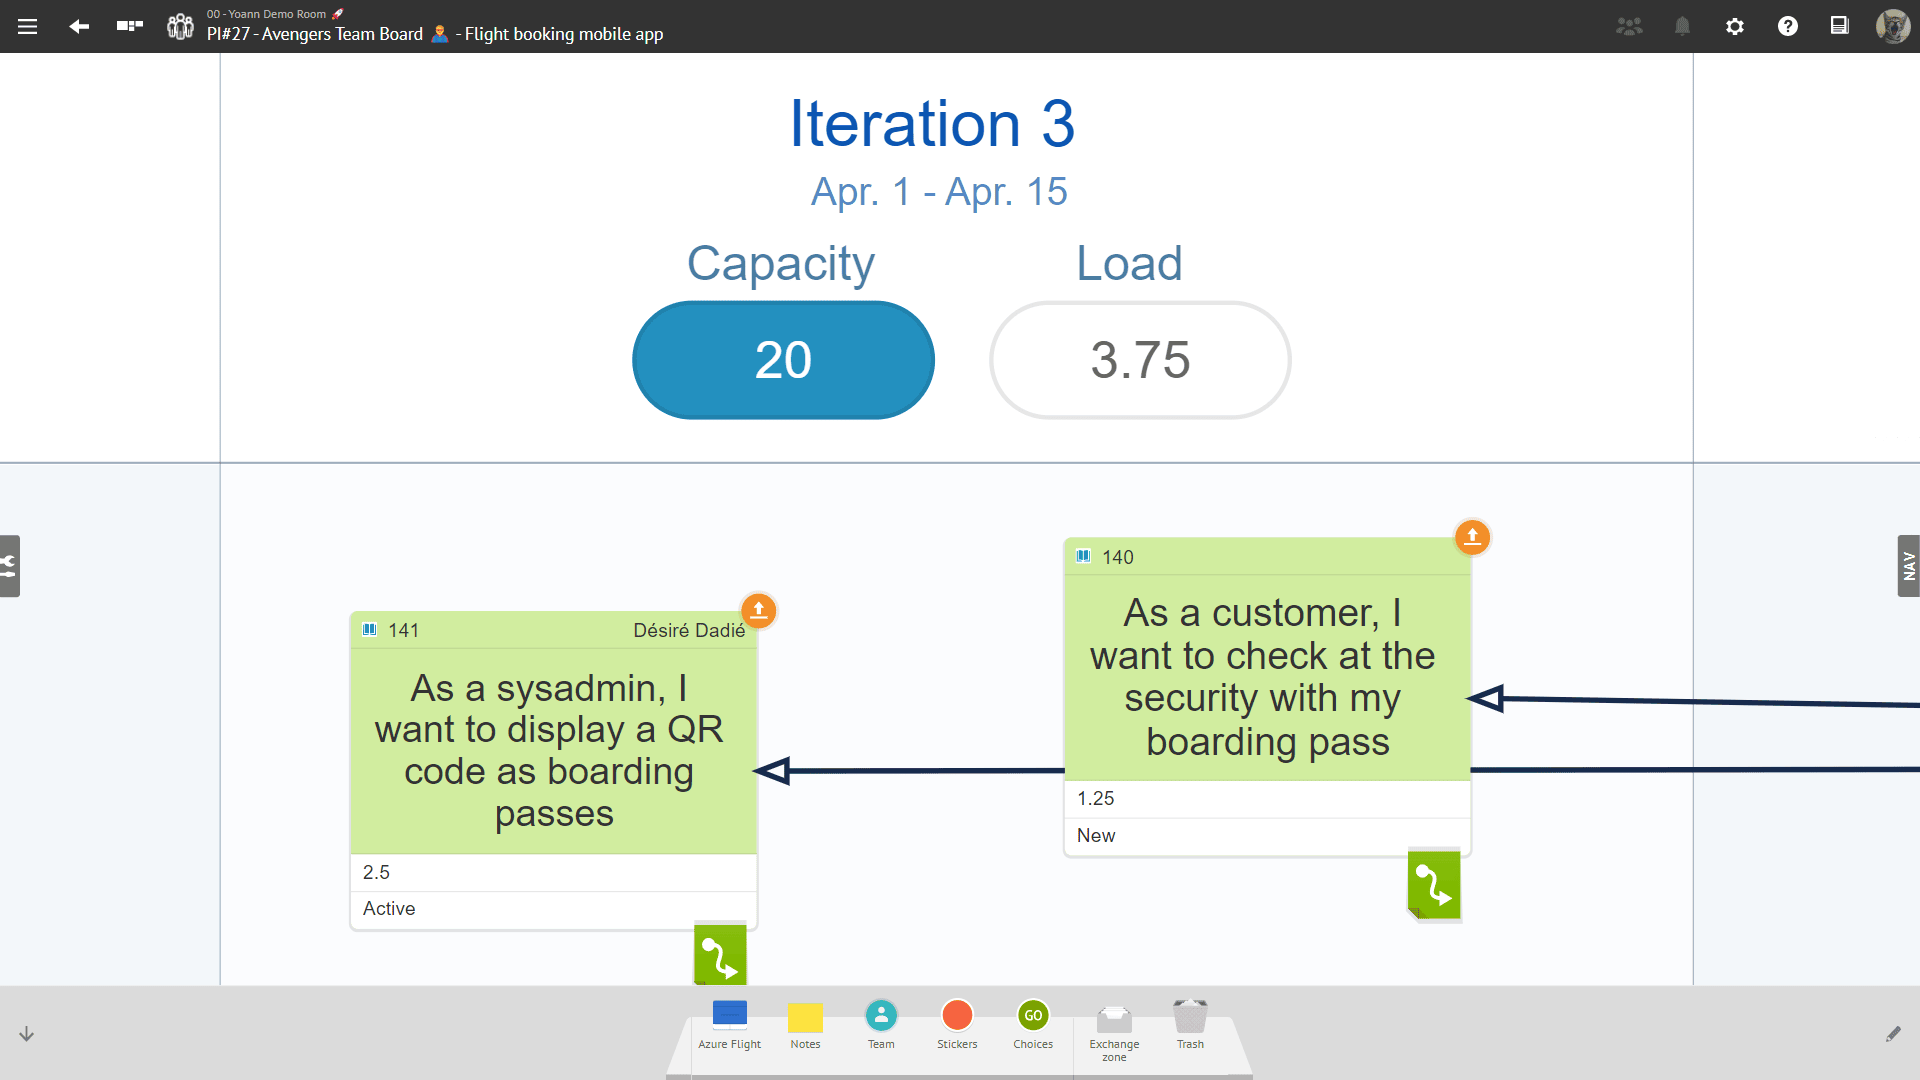
Load calculation takes into account story points with decimal values
This new version of iObeya brings the support for decimal values that can be used in the Story Point field for Jira / ADO Sprint boards and Agile team boards allowing the teams to define more precisely the effort required to deliver a piece of work.
If you are already using decimals, the load on your existing boards should be automatically updated after the upgrade to version 4.16.
Manage parent-child dependencies between Jira cards
The new version of our Jira connector for iObeya allows project teams to visualize the parent-child dependencies between Jira issues directly within the iObeya platform.
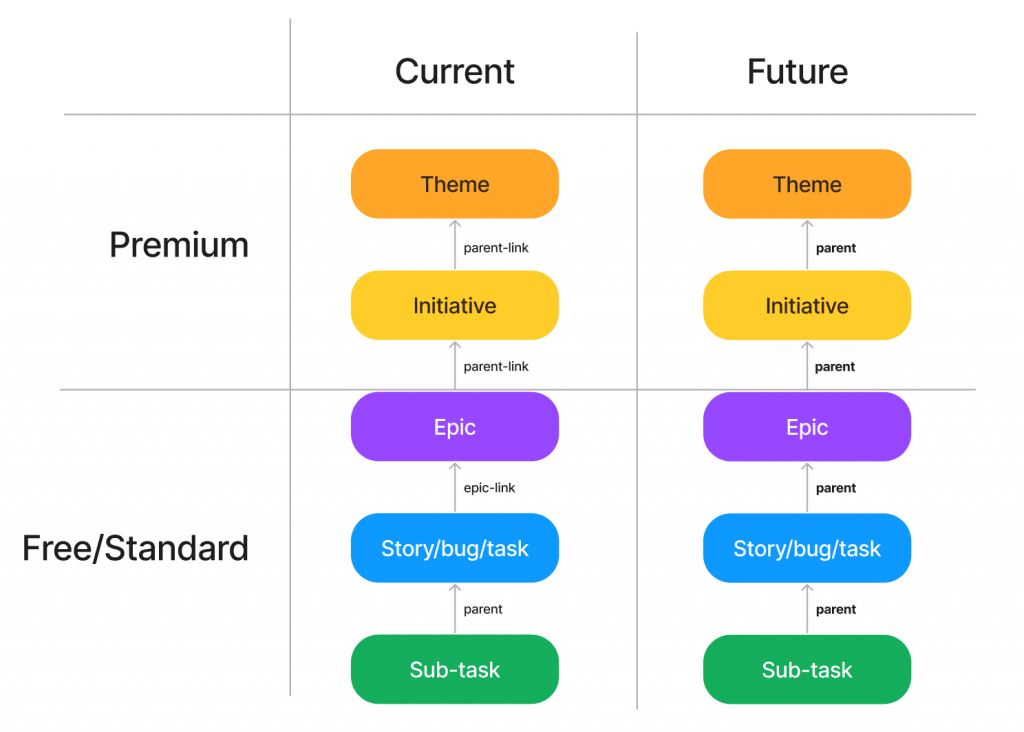
You can now see, directly from iObeya, how different Jira cards are related to each other and understand the impact that changes to one issue may have on others.
This new feature is available in three different contexts:
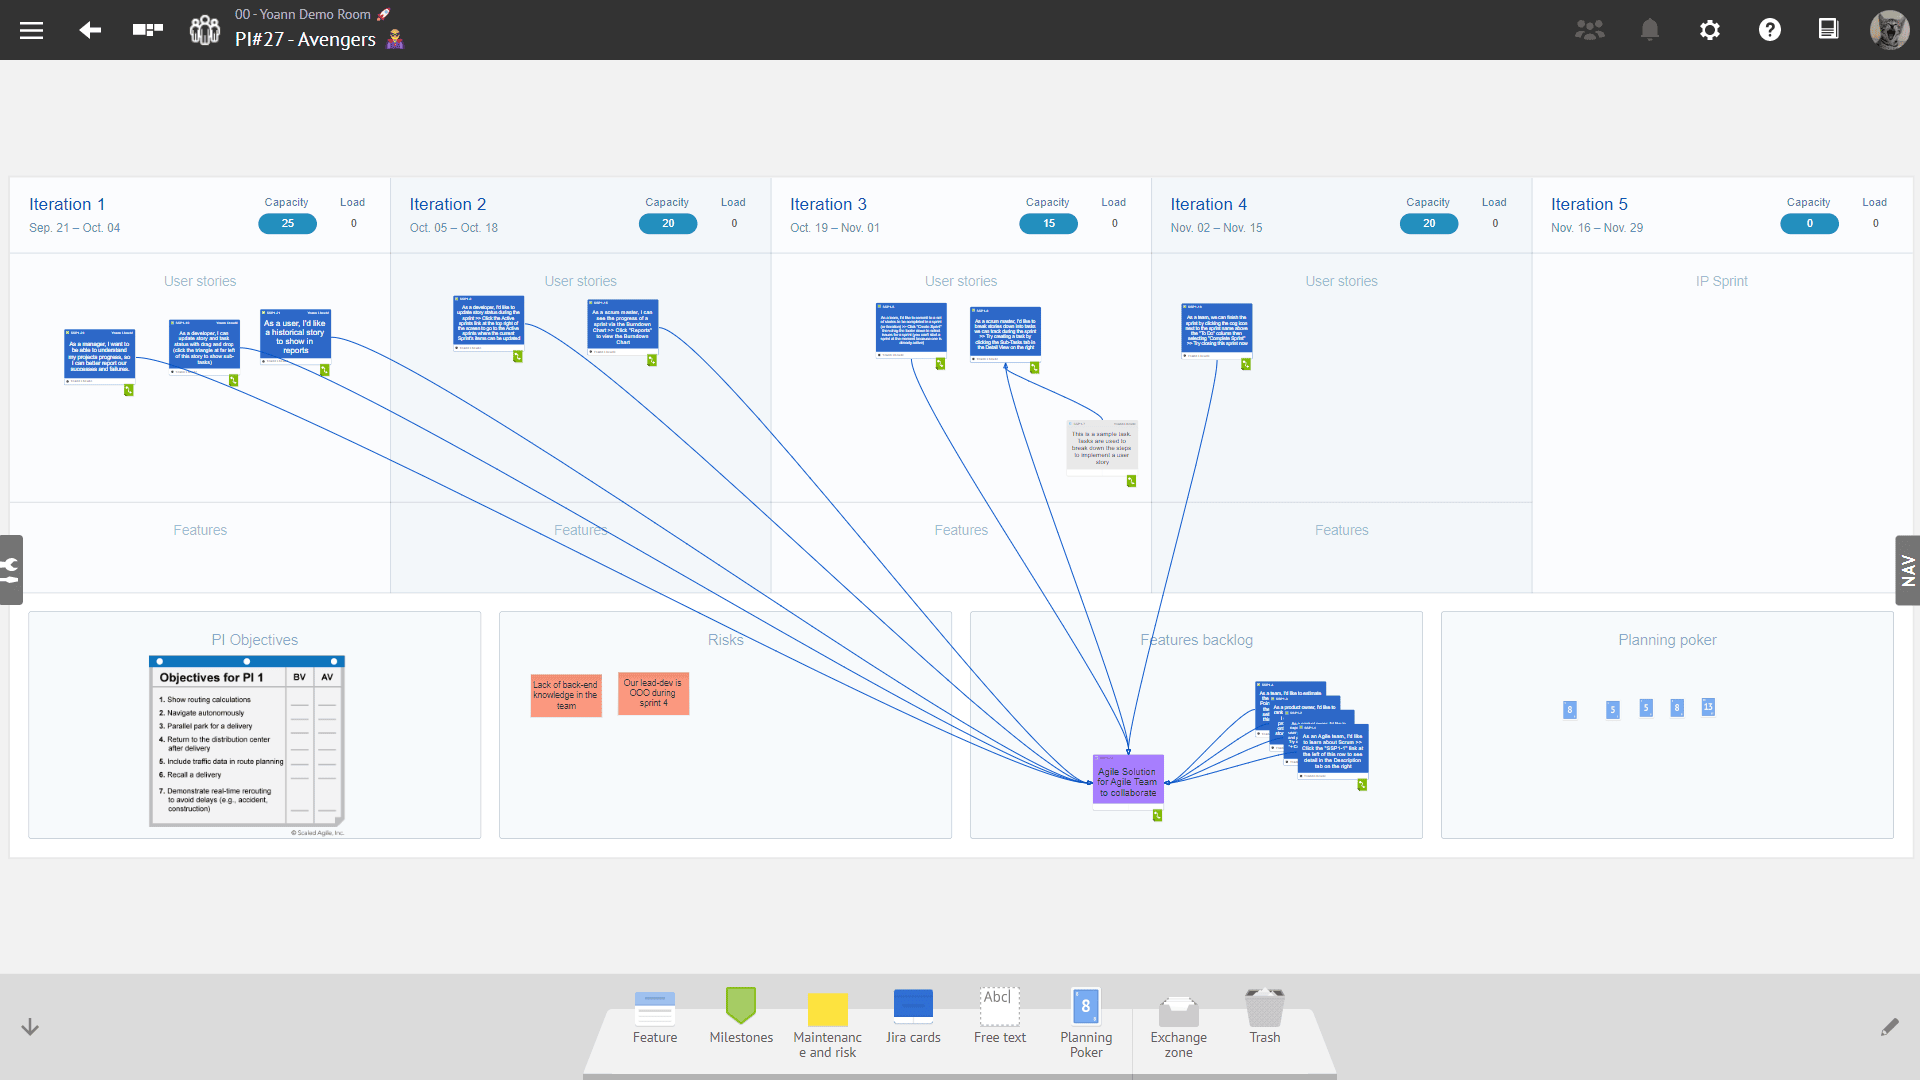
- From your board: by displaying blue links between Jira cards that have a parent-child relationship.
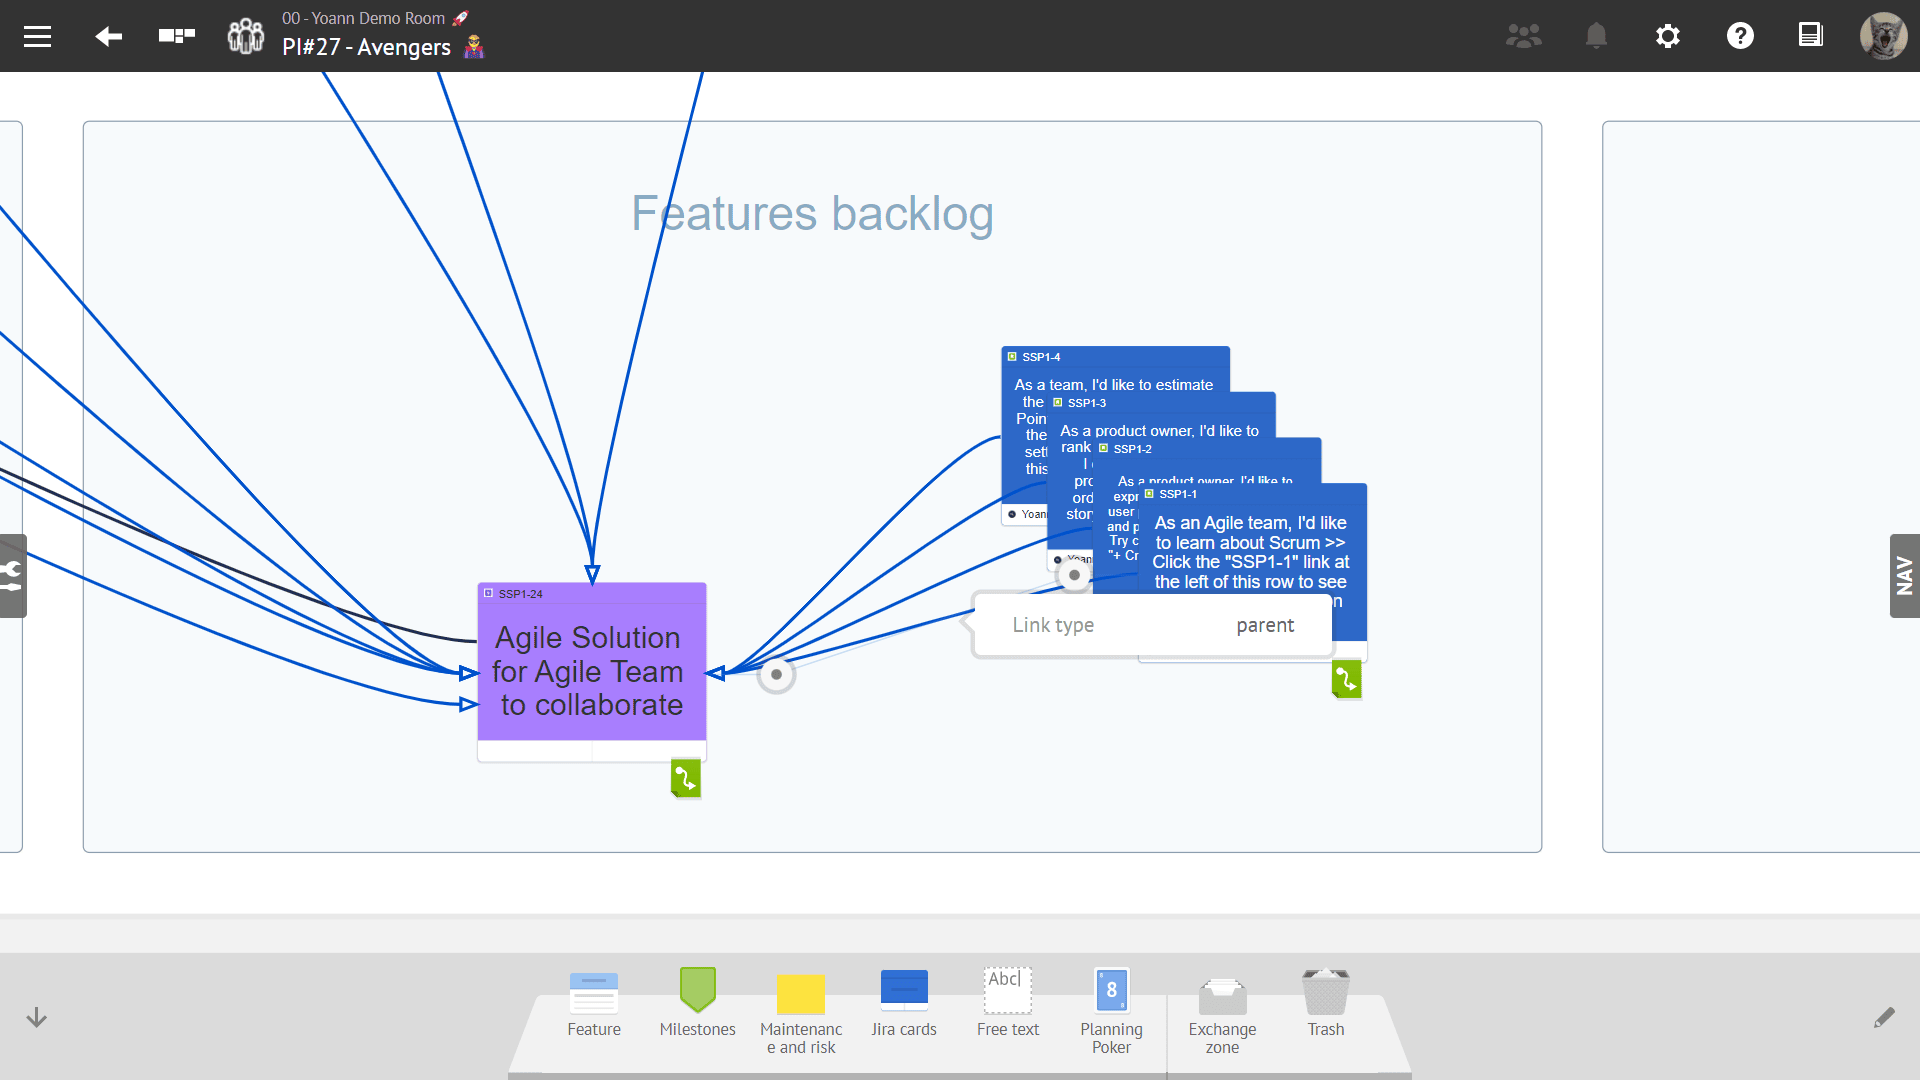
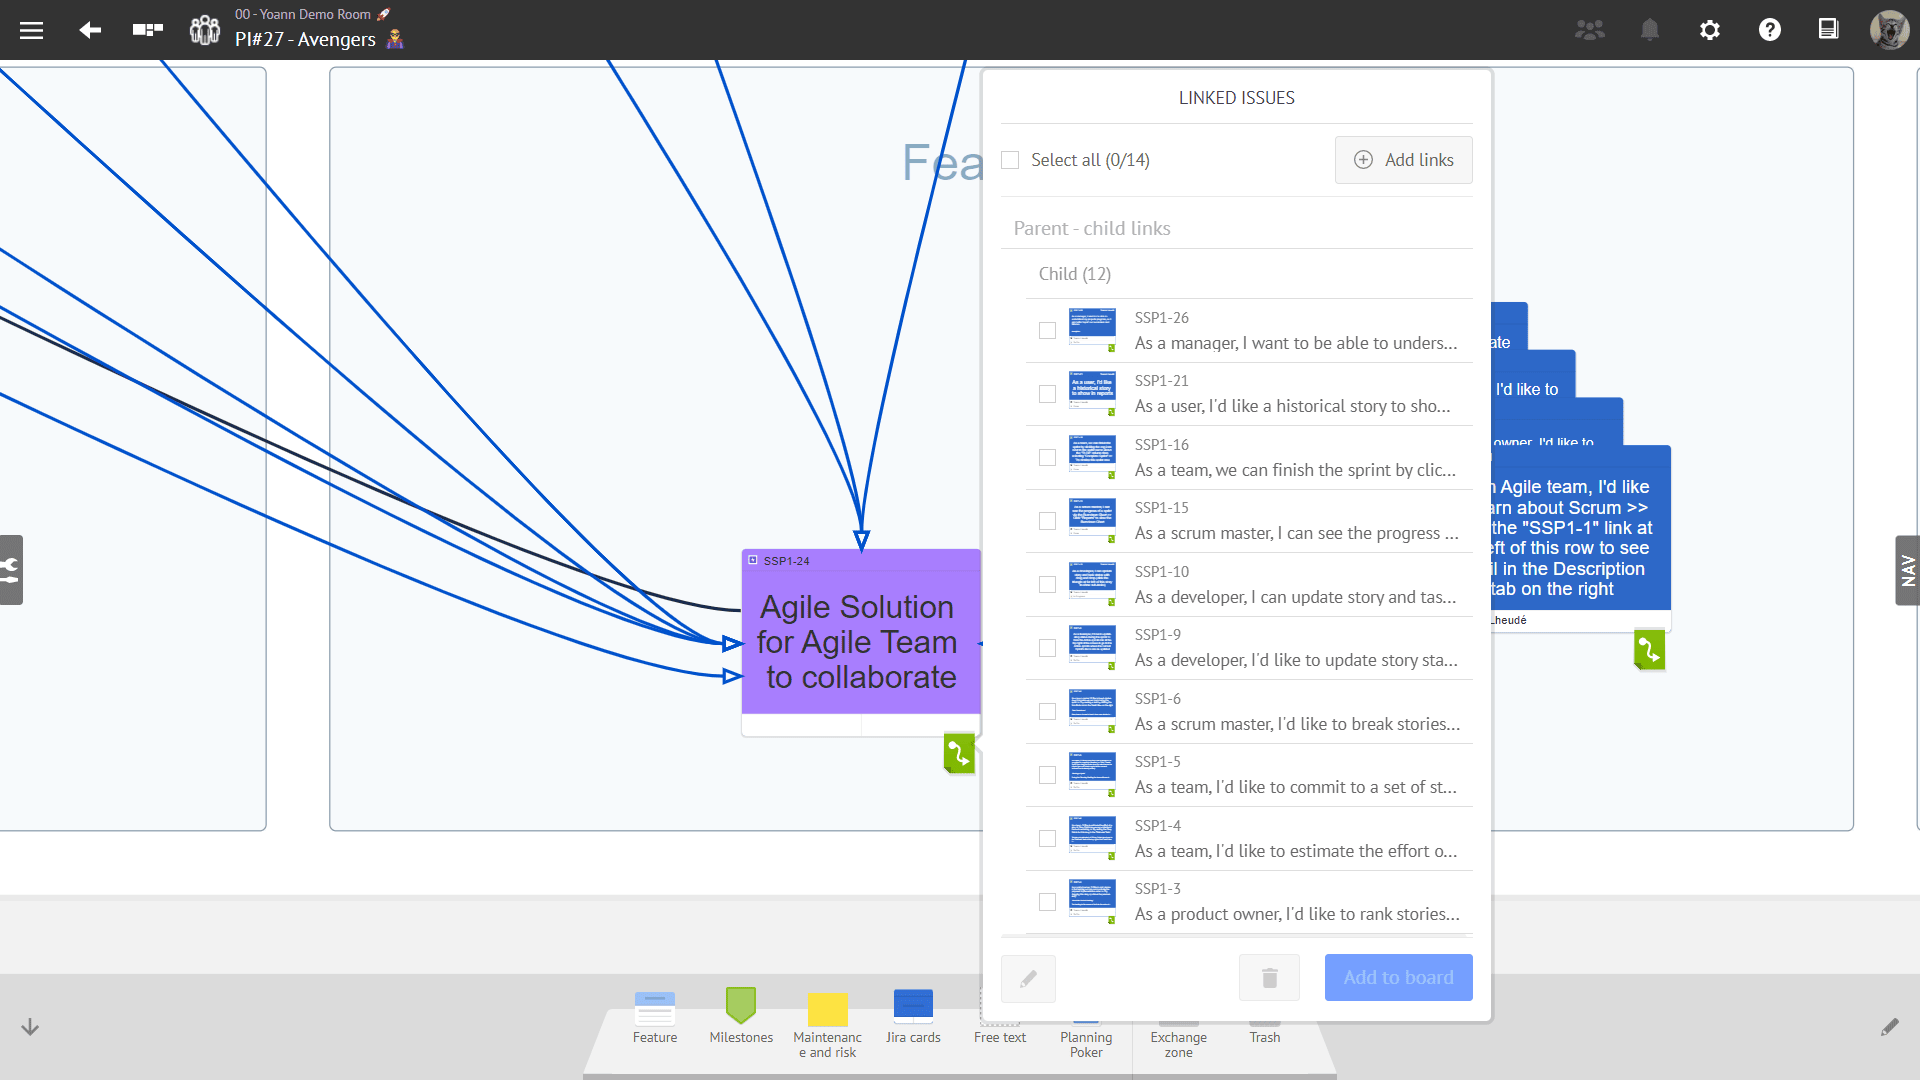
- From a Jira card: by opening the collection view of a Jira card, you can see all the parent and/or child issues available in Jira, in addition to the already existing linked issues.
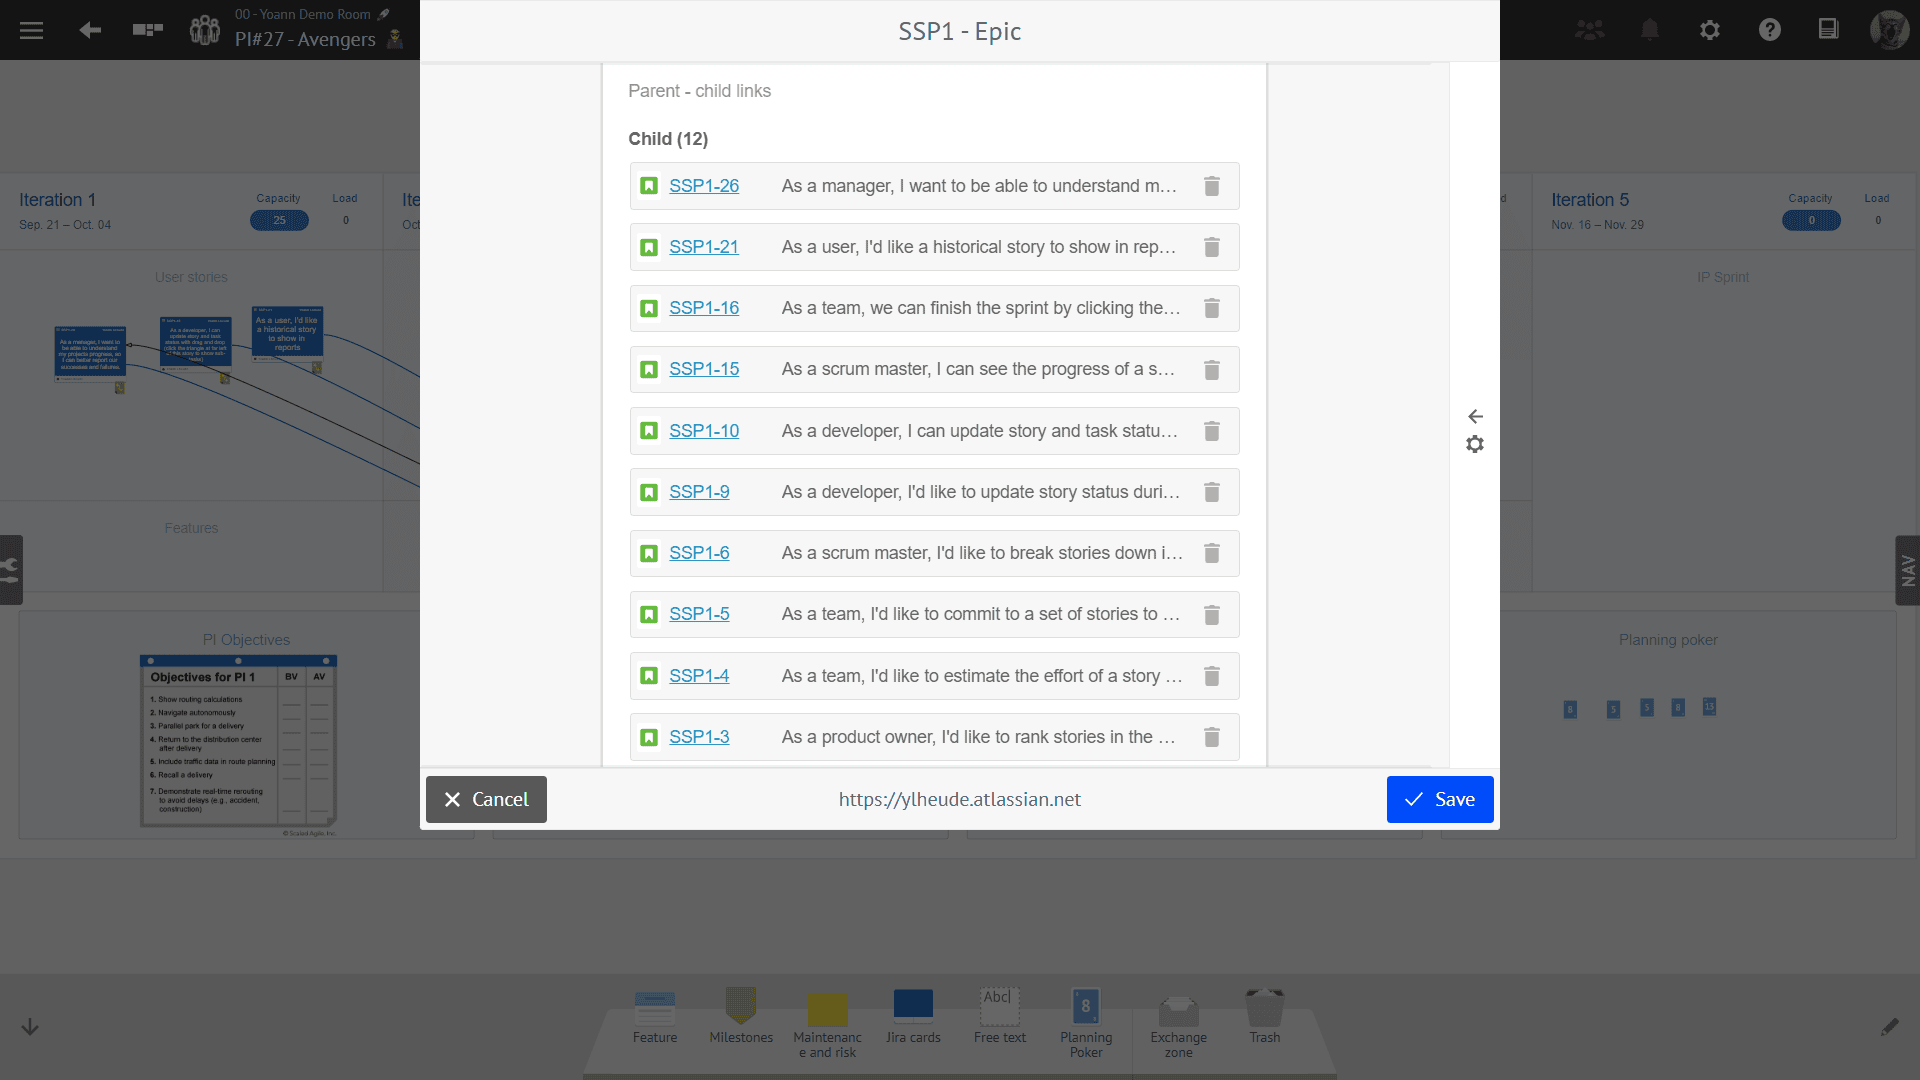
- From the card editor: you can see, create, and remove parent-child dependencies when editing a Jira issue from iObeya.
This information can be critical for effective project planning, task prioritization, and cross-team collaboration. Here are some benefits offered by visualizing the parent-child dependencies directly from iObeya:
- Improved visibility: It allows teams to easily understand the relationships between Jira issues, which can help improve overall efficiency and understanding of the project.
- Better agile planning: Understanding and visualizing the parent-child dependencies between Jira issues helps teams create more accurate project plans and identify potential risks and issues early on in the process. The new capabilities offered by our Jira connector can be especially useful for agile teams, as it allows them to see the dependencies between user stories, features, epics, and adapt priorities based on the overall project progress.
- Time-saving automation: when adding stories to a board during PI Planning, for instance, it will not be necessary to draw iObeya links and then enter them manually in Jira anymore: creating a parent-child relationship in iObeya will automatically add it to Jira and vice-versa.
Platform administration
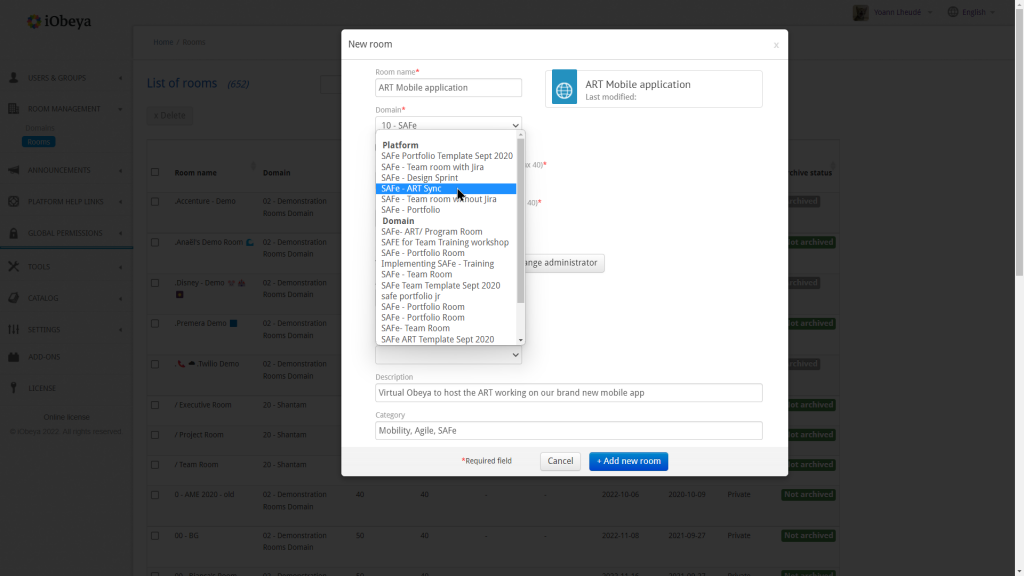
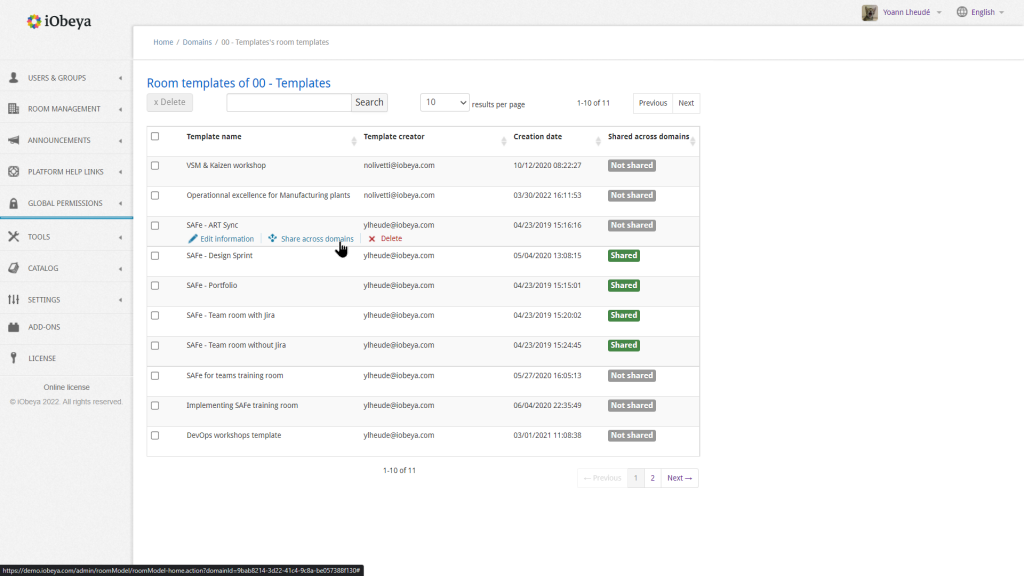
Shared room templates across platform domains
Release notes 4.16 On Premise
To learn more about what changed in iObeya 4.16, read the detailed Release notes to get the full list of changes and bug fixes included in this new version.