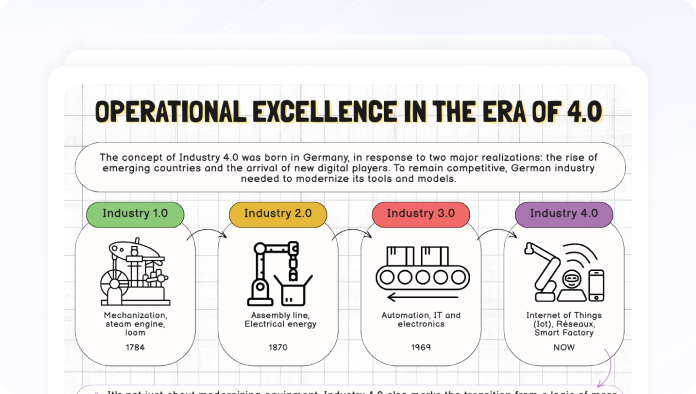
Why iObeya
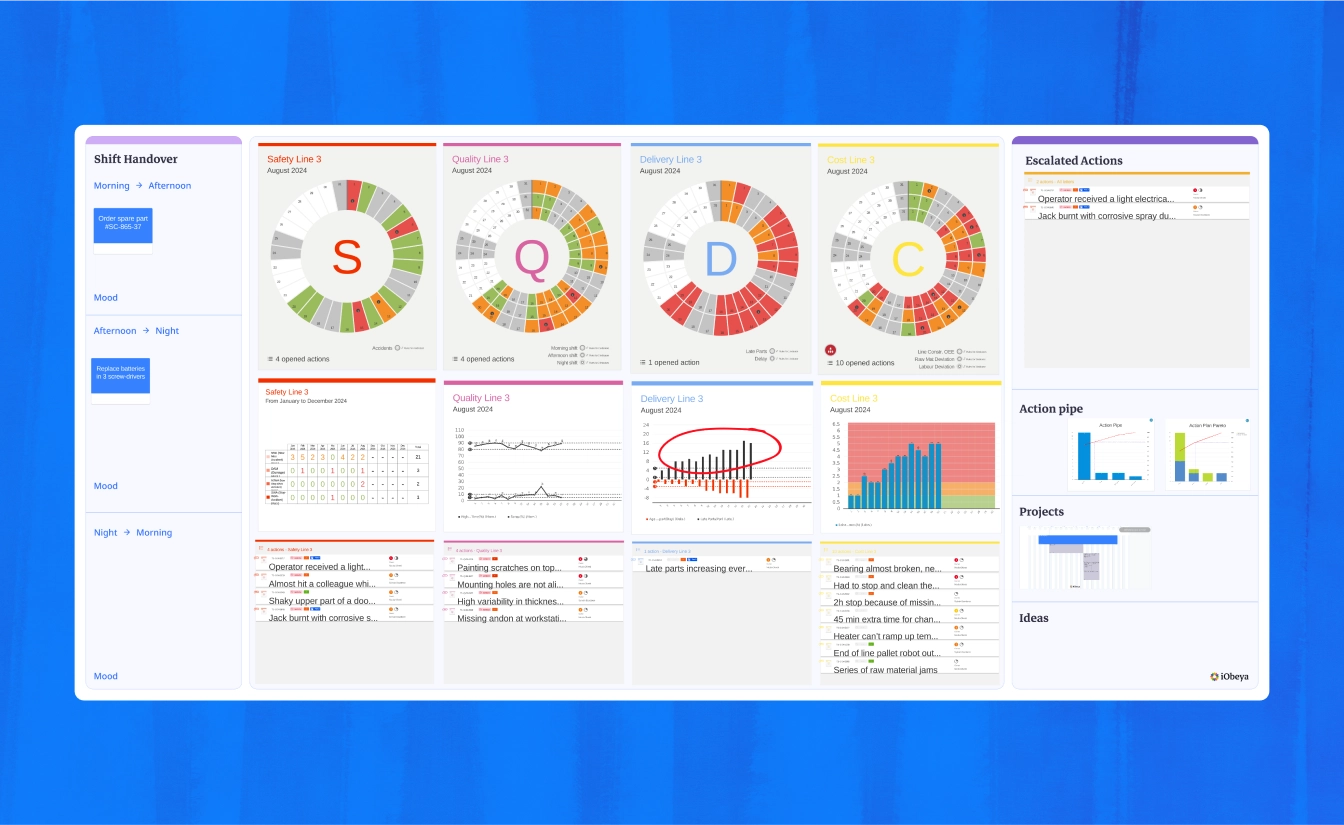
Many companies, especially those implementing Lean methodologies , need effective tools to visualize, manage, and analyze their production processes. iObeya offers a digital solution for managing Quality, Cost, and Delivery (QCD) boards, which are essential in Lean environments. However, to make the most of this data, companies need robust analytics that allow for in-depth insights into QCD actions, trends, and escalation handling. Integrating iObeya with Microsoft Power BI via Azure services helps bridge this gap, enabling advanced analytics and data-driven decision-making.
This article explores the process, benefits, and key features of integrating iObeya with Power BI, illustrating how this integration enhances the management of QCD actions and provides management teams with real-time insights through user-friendly dashboards.
Before the integration of iObeya with Power BI, organizations faced several obstacles when attempting to track and analyze QCD actions:
While iObeya is excellent for visual management, creating specific, tailored analytics on QCD actions required custom development requests, which were time-consuming and potentially costly.
Without a streamlined analytics solution, escalations in the lean production system were not always managed effectively. Tracking the average time to close actions and monitoring trends were manual processes, making it challenging to ensure timely responses.
Teams often struggled with fragmented data that couldn’t be easily aggregated and analyzed. This made it difficult to monitor QCD action trends over time or evaluate the health of the management process.
These challenges highlighted the need for an integrated analytics solution that could automate data extraction from iObeya and allow for flexible, powerful reporting and visualization.
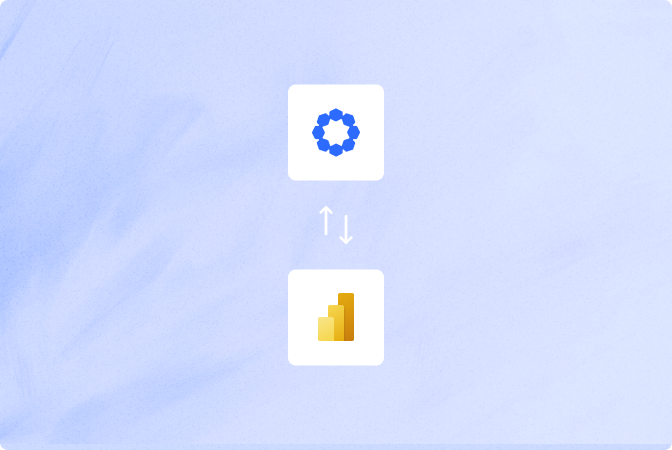
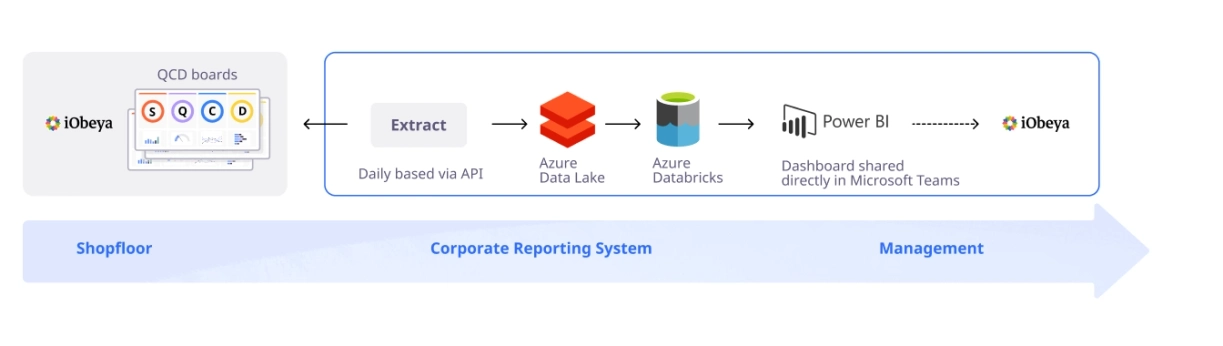
The solution involves connecting iObeya QCD boards to Power BI , leveraging Azure Data Lake and Azure Databricks as intermediaries. Here’s how it works:
Through an API connection, data from iObeya QCD boards is automatically extracted on a daily basis . This data includes critical information related to action items, such as average days to close actions and creation trends.
The extracted data is sent to Azure Data Lake, a secure data repository that supports large-scale analytics. From there, Azure Databricks processes the data, preparing it for visualization. Databricks, known for its speed and scalability, enables the transformation and cleaning of data to ensure consistency and accuracy.
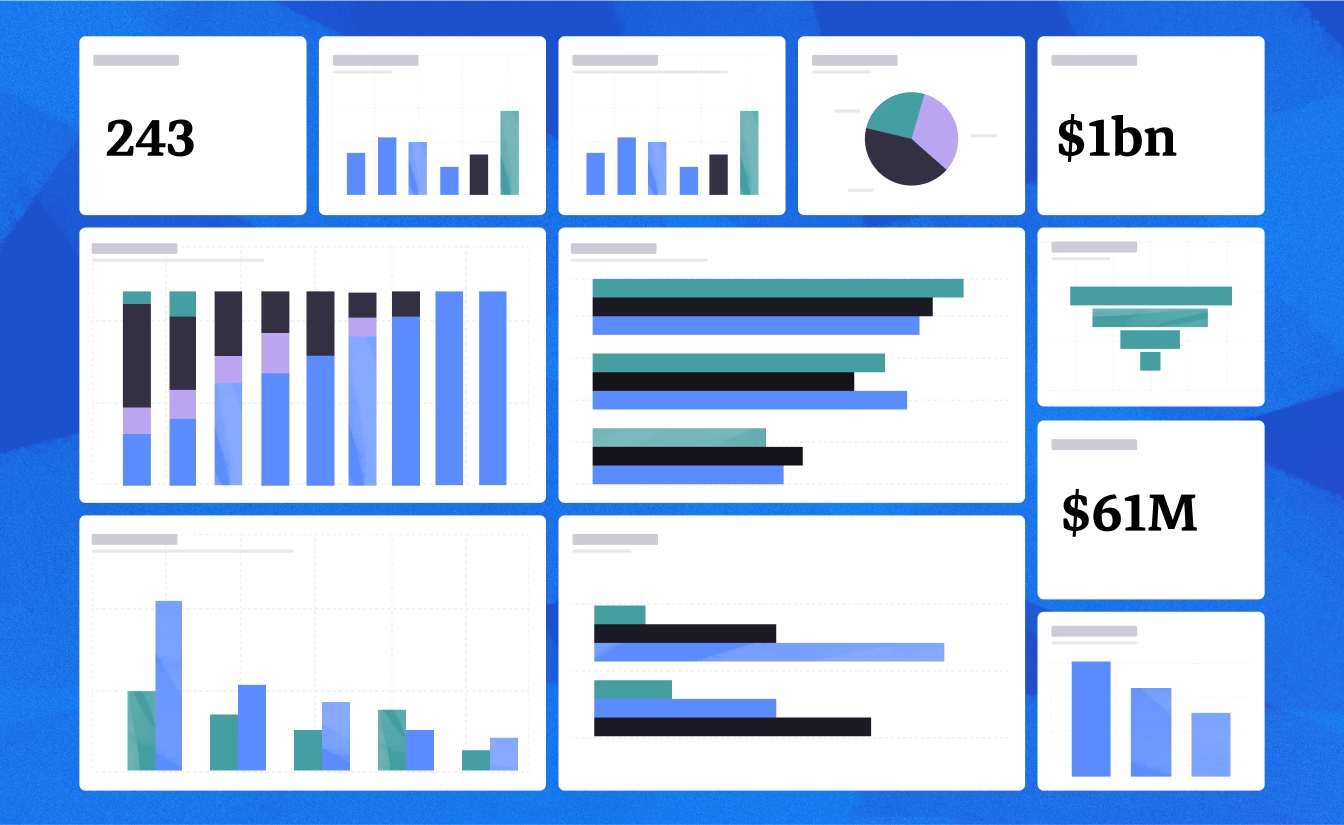
The processed data flows into Power BI, where dynamic dashboards are created. These dashboards are designed to provide insights into QCD actions, showing trends, escalation management effectiveness, and the overall health of the production process.
The Power BI dashboard is shared directly within Microsoft Teams , giving management and shop floor teams easy access to up-to-date insights. This setup enhances cross-functional collaboration, as stakeholders can discuss findings and make decisions based on real-time data.
Data from iObeya QCD boards is automatically refreshed daily into Power BI dashboards, giving stakeholders access to the most current information. Teams can easily monitor average closure times, creation trends, and escalation rates, ensuring faster responses.
Customizable dashboards . Power BI allows full flexibility to tailor dashboards and highlight the most relevant KPIs for each team. Scalability. The Azure cloud infrastructure supports large data volumes, enabling organizations to scale analytics capabilities seamlessly.
Embedding Power BI dashboards in Microsoft Teams makes it easy for team members at all levels to view and discuss performance metrics. This fosters transparency, teamwork, and alignment across the organization.
Enhanced decision-making . Managers gain real-time insights into QCD action trends and escalation handling, allowing more informed and timely decisions.
Reduced dependency on custom development . Teams can design tailored analytics directly in Power BI, reducing reliance on custom reports and accelerating continuous improvement.
Better visibility into escalation trends and action closure rates ensures more effective issue handling in lean production systems. With clear trend analysis, problem areas can be prioritized and addressed quickly.
Streamlined escalation management . Escalation bottlenecks are identified earlier, helping maintain smooth operations.
Data-driven culture. Easy access to actionable analytics encourages teams to base decisions on facts and insights rather than assumptions, embedding continuous improvement in daily operations.
1. Defining Technical Specifications:
2. Azure Data Lake and Databricks Configuration
The Power BI dashboard is linked to Microsoft Teams for easy access by shopfloor and management teams.
The integration is tested to ensure data accuracy, and the dashboard is optimized to provide actionable insights.
As needs evolve, the Power BI dashboard can be adapted to incorporate new metrics or insights based on user feedback.
The integration of iObeya with Power BI via Azure services significantly improves the management of QCD actions and enhances operational efficiency . By enabling real-time, customizable analytics and seamless data sharing, this integration empowers organizations to make faster, data-driven decisions, ultimately improving Lean processes and escalation management.
Organizations leveraging this integration gain flexibility and control over their data, with powerful visualization capabilities that help track and optimize action management processes. This setup not only aids in maintaining production efficiency but also cultivates a data-driven culture across teams.
Request a demo to learn more on how iObeya can enhance your Lean Management practices. Embrace the future of visual management and empower your team with tools that drive continuous improvement.
Explore how iObeya connects with your existing Lean Manufacturing tools like Power BI and Azure Data Lake to streamline your operations. Visit our Best-in-Class Integrations page. For more in-depth, technical information on iObeya’s integrations please visit our resource center .