

Version 4.45: New QCD Improvements to Support Performance Management 📊
Disclaimer 📢
The version 4.45 is a Cloud version. Therefore, the improvements and new features described below are only available for Cloud customers yet.
Of course, they will be available in the next certified version of iObeya for on-premise installations scheduled for Q3 2025.
Stay tuned!
General features
New Min/Max Aggregation Methods available in QCD Consolidation for sharper insights
QCD consolidation enables organizations to aggregate performance indicators across teams, projects, and organizational levels to build a reliable, shared view of performance. With iObeya 4.45, this capability is strengthened with the introduction of Min and Max aggregation methods, opening new ways to analyze results and drive improvement.
In addition to existing aggregation options, you can now consolidate indicators using minimum or maximum values. These new methods make it easier to:
- Surface critical performance limits instead of relying only on averages
- Identify outliers, bottlenecks, or top performers across multiple indicators
- Focus attention on what constrains or enables overall performance
- Mon = 1, Tue = 0, Wed = 2, Thu = 0, Fri = 1, Sat = 0, Sun = 1
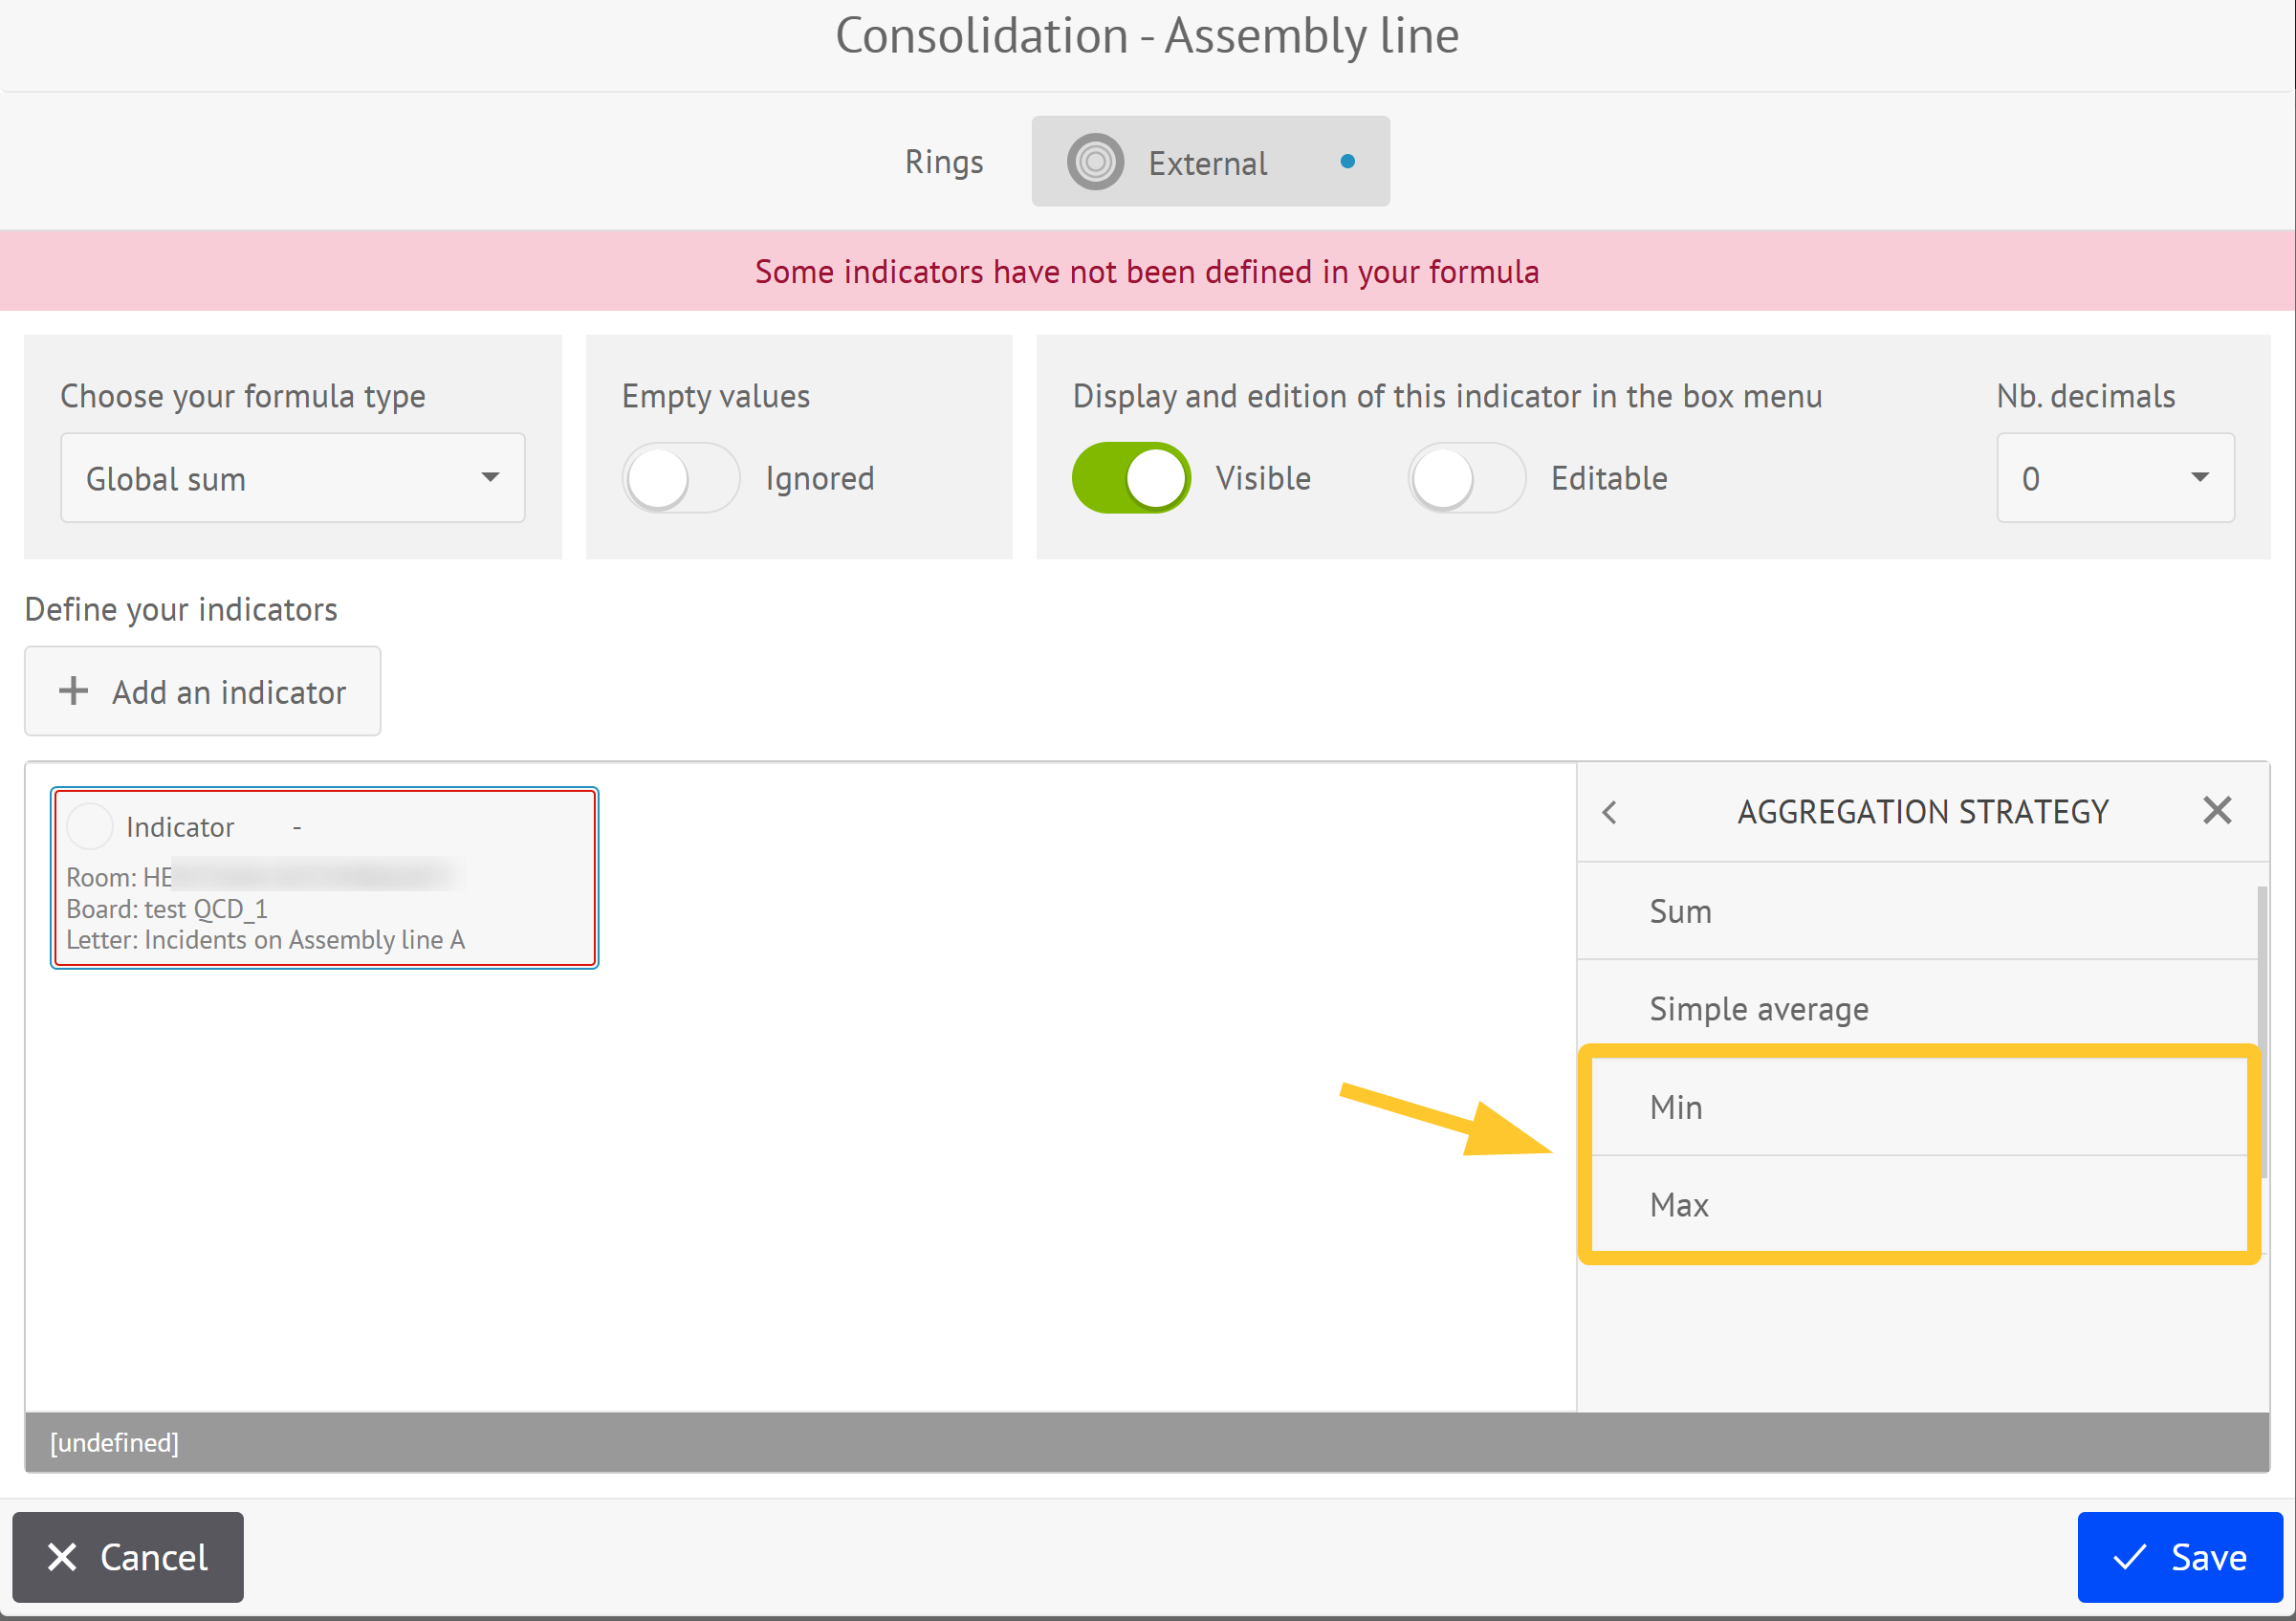
Min / Max selects the lowest or highest value in the week
- Min = 0 per week
- Max = 2 per week
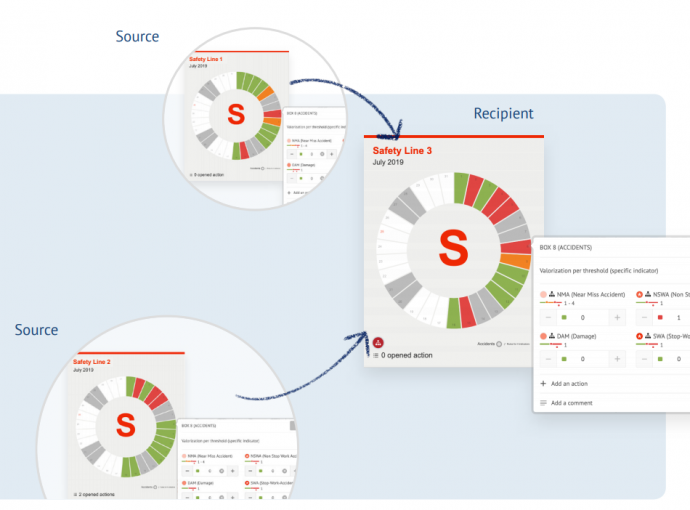
If you choose Max as the aggregation strategy it will give you the following result on your consolidated letter
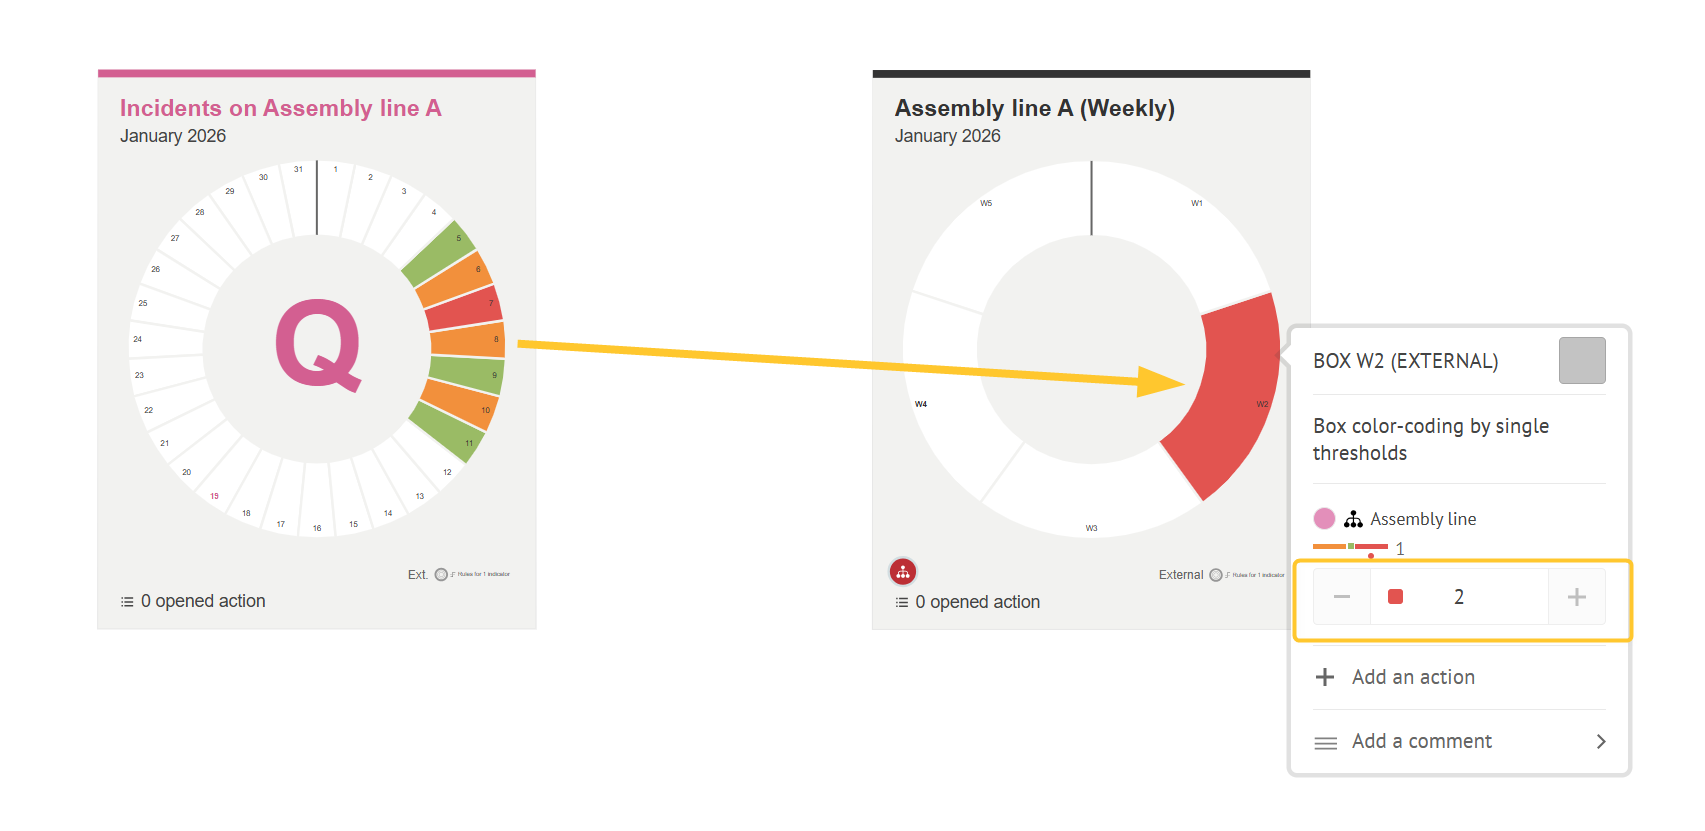
Thus, we know instantly that for an important indicator to follow such as Incidents on the production line the Max was 2 incidents in the week which is beyond our threshold and therefore shows us visually the color red.
Min and Max aggregation are particularly useful when a single weak point can impact system-level results, helping teams prioritize corrective actions and improvement levers.
What does consolidation really mean in iObeya?
By chaining consolidations, organizations can structure performance indicators from the operational level up to strategic dashboards, while maintaining consistency and traceability.
Consolidation is the key feature that makes QCD scalable across the entire organization, regardless of size or complexity.
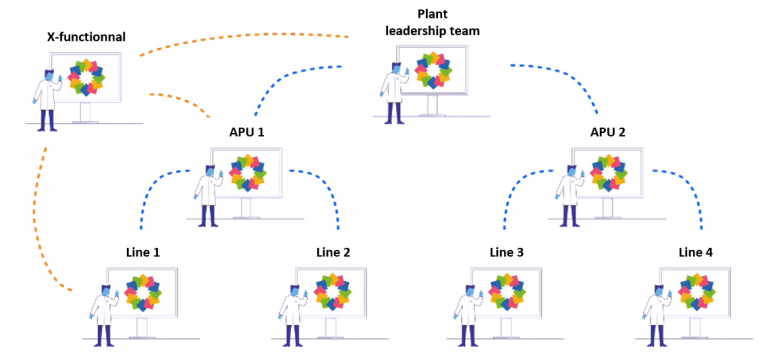
Combined with detailed consolidation views and flexible aggregation logic, it enables teams to understand how performance is built, identify root causes, and steer improvement efforts with confidence.
Release notes 4.45
To learn more about what changed in iObeya 4.45, read the detailed Release notes to get the full list of changes and bug fixes included in this new version.