
Why iObeya
In many organizations, defining KPIs often resembles a messy brainstorming session.
Everyone comes up with their own favorite indicator, often influenced by their own role, tools or local priorities.
The result? A multitude of indicators, poorly connected to strategic objectives, with no clear hierarchy or logical link.
The KPI Tree is a structured, visual and collaborative approach to connecting strategic objectives to operational indicators, through intermediate performance levers. In this article, I’ll explain why and how to implement it.
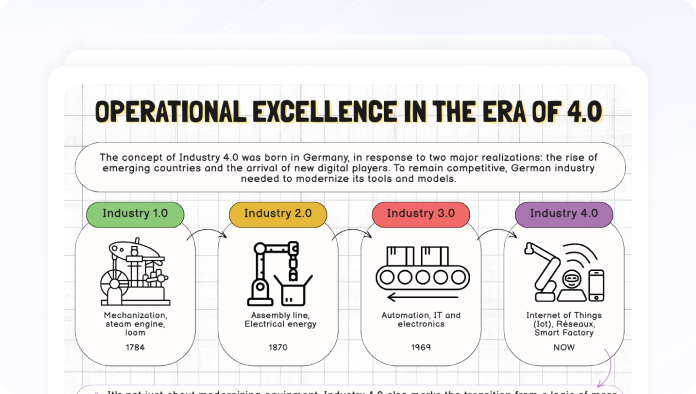
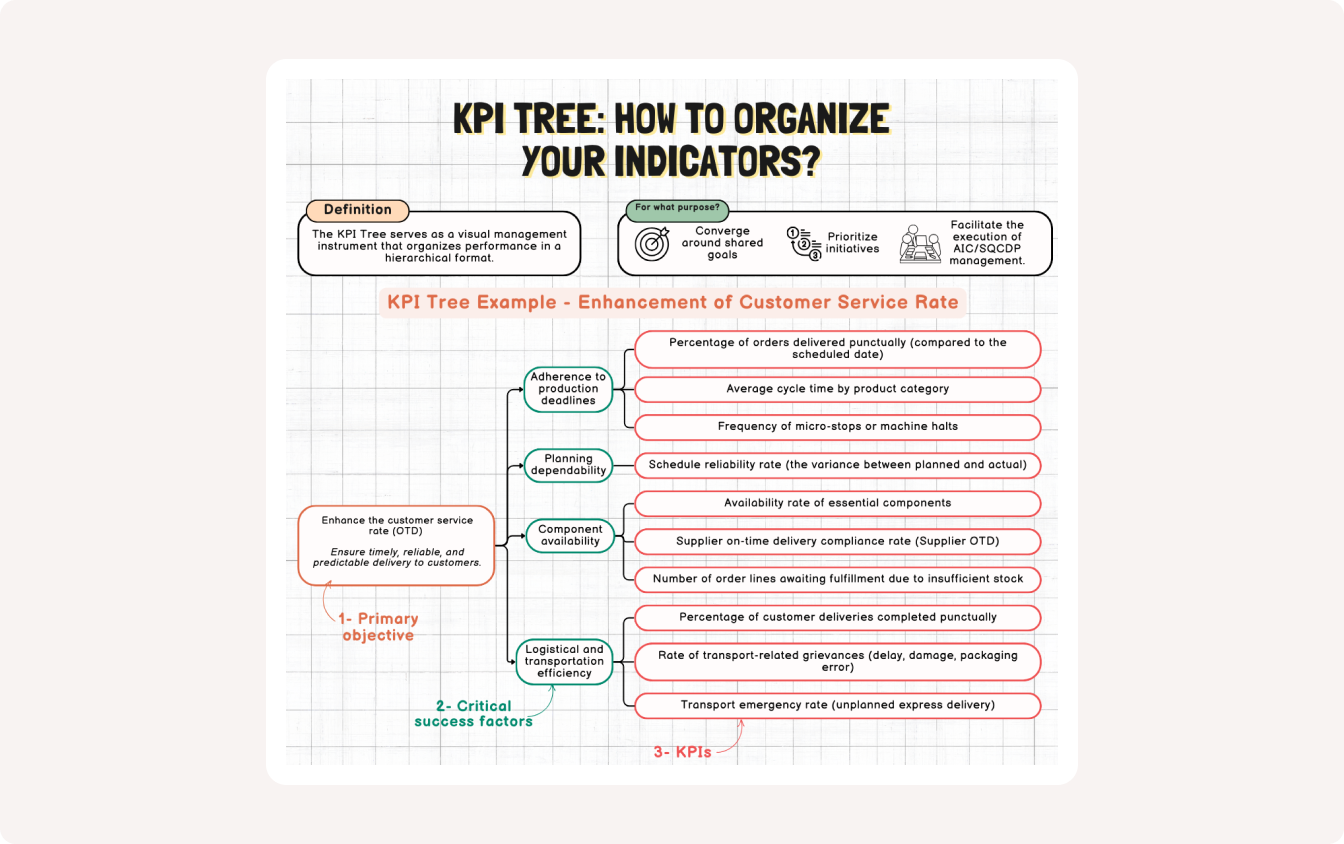
The KPI Tree is a visual management tool that structures performance hierarchically:
Each level is connected through a cause-and-effect logic. This framework helps teams understand performance levers as a whole and identify priority areas for action.The trees then clearly show how lower-level KPIs, such as workstation efficiency or machine downtime, have a direct impact on higher-level objectives, such as production volume and profitability.
Please note: The KPI Tree should not be confused with a Metrics Tree, which is more process-oriented than goal-oriented. The KPI Tree answers “Where are we going?” whereas the Metrics Tree answers “How does it work?”.
Strategic objective: “Improve the customer service rate (OTD)”.
Simplified tree :
→ CSF 2 : Optimize planning
→ CSF 3 : Improve transport reliability
Associated KPIs :
% of orders delivered on time (OTD)
This KPI Tree enables the company to identify the real levers for improving customer satisfaction, and to structure its daily reviews around the right indicators.
Building a KPI Tree is the first step. Managing it effectively over time is another. My advice: digitalize the process.
Digitizing the KPI Tree makes it possible to :