


Why iObeya
Most transformation business cases compare the cost of a new tool to its expected benefit, and stop there. This comparison overlooks an essential variable: the status quo has a cost too, and that cost doesn’t stop accruing as long as nothing changes.
The usual comparison, cost of the tool versus expected benefit , implicitly puts the status quo at zero cost, as if it were a neutral option while a decision is pending. That is never the case in daily management: a poorly filled-out paper board keeps producing late escalations, a team leader keeps losing time on manual re-entry, a decision keeps being made on data that’s already several days old.
Flipping the comparison, cost of not changing versus cost of changing, gives a more honest read of the decision actually facing a manufacturing leadership team.
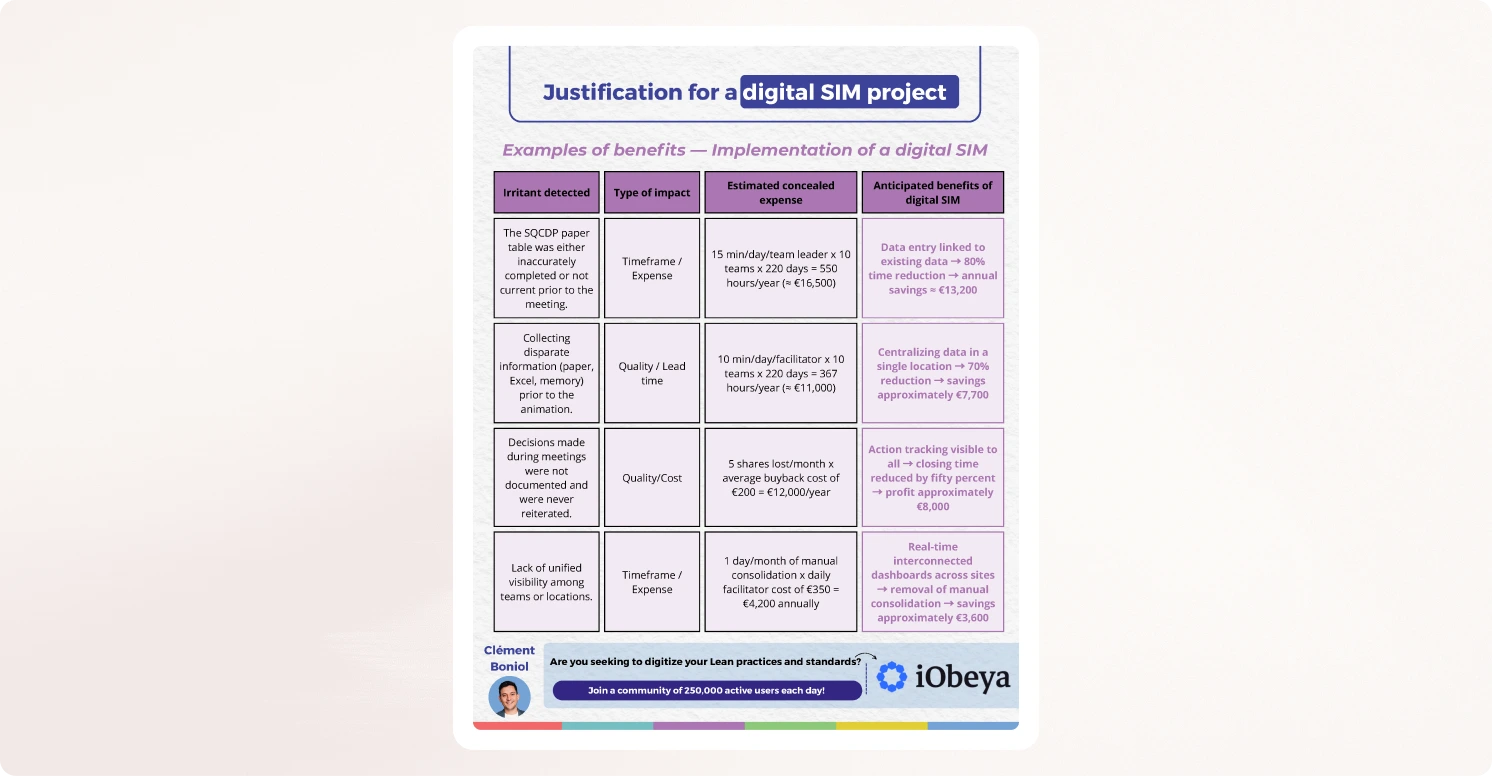
Labor time is lost to manual data entry and meeting prep. Every paper SQCDP board has to be filled out by hand, every indicator copied over from the ERP or MES before the morning meeting. At a 500-person site organized into teams of ten, this prep time adds up to tens of minutes per team leader per day , time that produces no decision in itself, it only makes the decision possible. The calculation is straightforward: number of team leaders x daily prep minutes x fully loaded hourly cost x number of working days per year.
Escalation delay. On paper, a problem detected at tier 1 has to wait for the next tier-2 meeting, sometimes the next day, to be formally flagged to the level above. This delay translates into lost production, accumulated scrap, or a customer discovering a quality deviation before the plant has corrected it itself. The calculation relies on the number of monthly incidents requiring escalation, the average delay observed, and the hourly cost of the unaddressed incident , often estimated from the production value lost per hour of a stopped or slowed line.
Missed improvement cycles. An improvement idea written on a paper board and never picked up at the tier above is a lost idea, not a pending one. Without an automatic follow-up system, the closure rate of improvement actions generally plateaus well below what it could be. The calculation compares the number of actions identified per year to the number actually closed, and values the gap at the average estimated gain per improvement action implemented.
Inconsistent practices across sites. Without a shared digital support, each site develops its own version of the SQCDP board, its own escalation rules, and sometimes its own definitions for the same indicator. Comparing performance between two sites becomes a translation exercise before it’s a management exercise. The cost is calculated as the time central teams spend reprocessing data that shouldn’t need harmonizing in the first place, multiplied by the number of annual reporting cycles.
Rework caused by stale decisions. A decision made in a meeting based on a figure that’s already several days out of date often leads to an action that later has to be undone or corrected. This rework is rarely counted as a management cost, even though it directly is one. The calculation tracks the number of corrective decisions per month linked to stale data, and the average cost of implementing a corrective action.
| Category | Typical input variable | Rate | Estimated annual |
|---|---|---|---|
| Manual entry and prep | 50 team leaders x 10 min/day x 220 days | Fully loaded hourly cost: €24.5/hr | ~€45 000 |
| Escalation delay | 15 incidents/month x 4h average delay x line hourly cost | Line hourly cost : €132/hr | ~€95 000 |
| Missed improvement cycles | 60% of actions unclosed out of 200 identified/year | Gain per action taken : €583 | ~€70 000 |
| Inconsistency across sites | 3 sites x 2 days/month of central reprocessing | Reprocessing cost per day: €9,166 | ~€55 000 |
| Rework from stale decisions | 8 corrective decisions/month x average action cost | Average action cost: €5,000 | ~€40 000 |
The effect of inaction doesn’t simply add up from one site to the next: it multiplies through the absence of a shared reading grid across sites, which worsens each of the five categories described above. Across a footprint of 90 sites comparable to Sanofi’s, the shift to a connected, digitized daily management system delivered an estimated efficiency gain of €4.5 million (over six-year period, risk-adjusted), on top of a meeting efficiency improvement valued at €14.2 million across the full footprint. Neither figure measures a hypothetical future gain: both measure, in mirror image, what inaction had been costing all along, accumulated site after site, year after year. For an industrial group of this size, the cost of inaction is therefore not a linear multiple of a single site’s cost , it is an amount that grows with every additional site that remains outside the shared system.
This calculation framework has limits that should be acknowledged rather than hidden. The typical values used here are orders of magnitude, not certified measurements for your site; they need to be recalculated with your own data before any official presentation. Some categories, in particular missed improvement cycles, rely on an estimate of the average gain per action that varies considerably by sector and by the organization’s maturity. A figure built on reasonable, explicitly documented assumptions is still more useful to decision-making than no figure at all , which is precisely the starting point for most organizations that have never formalized the cost of their status quo.
The value of this exercise therefore doesn’t rest on pinning down each category to the last euro, but on what it changes in the conversation: turning a continuous-improvement topic, perceived as discretionary spending, into a management topic about an already-existing recurring charge. Once that figure is on the table, the question is no longer “why invest,” but “for how much longer do we keep paying without acting.”
One last point is worth underlining: this calculation isn’t meant to be produced once before an investment decision and then archived. The organizations that get the most value out of it recalculate it every year, using the actual data from the year just ended, to check that the cost of inaction is moving in the expected direction , whether it falls after a transformation is undertaken, or keeps growing if nothing has changed. This annual tracking turns a one-time business case argument into a full-fledged management indicator, on par with any other indicator tracked by manufacturing leadership.