



Why iObeya
OEE, Overall Equipment Effectiveness, measures the share of production time a machine or line actually uses to make good parts on the first attempt, compared with its planned production time. It is calculated by combining three components: availability, performance, and quality. It is the most widely used indicator in operational excellence for summarizing the real state of a piece of production equipment in a single number, but it is also, by design, a lagging indicator: it describes what already happened, not what needs to happen next.
Its main appeal lies in how easy it is to read: a single percentage lets you compare two lines, two teams, or two sites without having to detail, every time, the breakdowns, the slowdowns, and the scrap that make up that figure.
That’s also its main limitation, addressed further down in this guide: a single score can mask very different root causes, and mistaking the indicator for the diagnosis regularly leads to poorly targeted action plans.
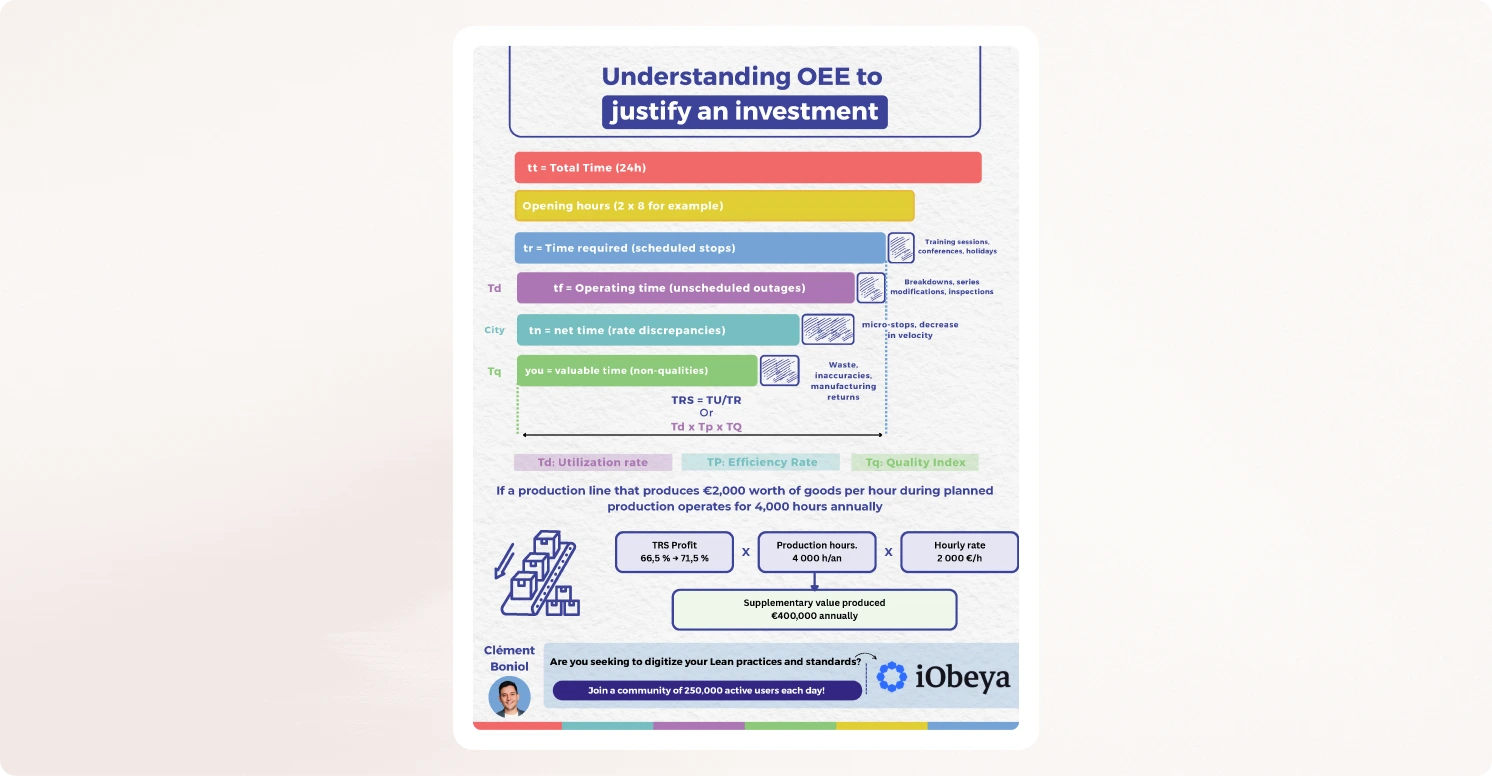
OEE = Availability x Performance x Quality. Each component is calculated separately, then the three are multiplied together to produce an overall score, always expressed as a percentage.
Availability measures actual production time against planned production time. If a line was scheduled to run for 480 minutes during a shift and stopped for 60 minutes for a changeover or a breakdown, its availability is 420/480, or 87.5%. This component captures everything that keeps the machine from running when it should be: breakdowns, changeovers, micro-stops not accounted for elsewhere.
Performance compares the actual rate to the machine’s theoretical rate during the time it was actually running. A line capable of producing 100 parts per hour but only producing 80 over the period has a performance of 80%. This component captures slowdowns: tooling wear, imperfect settings, an operator compensating for a defect by reducing the rate.
Quality measures the share of conforming parts among everything produced. Out of 1,000 parts made, if 950 are good on the first attempt and 50 need rework or get scrapped, quality is 95%. This component captures defect losses: scrap, parts sent back for rework, and rejects produced while the line is warming up after a start or a changeover.
Take an eight-hour shift, 480 minutes, on a packaging line.
Planned production time is 480 minutes, including 40 minutes of downtime for a conveyor breakdown and 20 minutes for a changeover. Actual production time is therefore 420 minutes. Availability is calculated as follows: 420 / 480 = 87.5%.
During those 420 minutes, the line runs at a theoretical rate of 60 parts per minute, which would yield a maximum of 25,200 parts. It actually produces 20,160. Performance is calculated as follows: 20,160 / 25,200 = 80%.
Out of the 20,160 parts produced, an end-of-line quality check identifies 1,008 nonconforming parts requiring rework. Parts good on the first attempt therefore number 19,152. Quality is calculated as follows: 19,152 / 20,160 = 95%.
This shift’s OEE is then: 0.875 x 0.80 x 0.95 = 0.665, or 66.5%. This single figure sums up in one glance what the three components taken separately would take three sentences to explain; this is precisely what makes it such a widely used indicator in performance reviews.
| Sector | Typical OEE | World-Class OEE |
|---|---|---|
| Manufacturing (average across all sectors) | ~60% | ~85% |
| Discrete production with high variability | ~55% | ~80% |
| Continuous process (chemicals, food and beverage) | ~65% | ~88% |
| Automotive assembly | ~~70% | ~90% |
OEE has a structural limitation that no refinement of the calculation can fix: it is a lagging indicator. It tells you what happened over a shift, a day, or a week that has already passed; it says nothing about what needs to happen this morning for the current shift to finish better than the last one. An OEE of 66.5% calculated at the end of the week arrives too late to fix the conveyor breakdown that caused it to drop.
This is where the daily management system (DMS) comes in, with its SQCDP board tracked in real time. Where OEE summarizes a past result, the SQCDP board tracks leading indicators: a stoppage in progress, a rate drift detected on the spot, a quality defect flagged before it spreads across the whole batch. OEE tells you where performance stands; the DMS tells you why it stands there and what to decide, meeting after meeting, to move it forward. The DMS is what turns a disappointing OEE score into a concrete action plan, rather than a mere observation repeated every week with nothing changing.
In practice, this connection plays out daily in the tier-1 meeting. The team doesn’t discuss last week’s OEE score there; it discusses this morning’s stoppage, the rate drift just detected, the nonconforming part spotted before it spreads across the whole batch. It’s the accumulation of these daily micro-decisions, made while the problem is still fixable, that determines whether the OEE calculated at week’s end improves or stalls.
The formula for translating an OEE gain into financial value is direct: percentage of OEE improvement x planned production hours x hourly throughput value. If a line that produces €2,000 of value per planned production hour runs 4,000 hours a year, and an organization targets an OEE gain of 5 points (for example from 66.5% to 71.5%), the calculation gives: 0.05 x 4,000 x €2,000 = €400,000 of additional production value generated over the year, with no extra production hours and no new equipment.
This calculation becomes an investment argument once it’s set against the cost of a daily management digitization project. Based on iObeya customer deployments, sites that connect their SQCDP board to real-time production data detect and correct rate drifts and micro-stoppages faster than with paper-based tracking, which translates directly into an OEE gain that’s faster to reach and easier to sustain over time. iObeya doesn’t calculate OEE in place of an industrial supervision system; it makes visible, day after day, what needs to change for the OEE measured at week’s end to actually improve.
Averaging OEE across multiple lines or sites without keeping the breakdown by component. An overall OEE of 65% can mask one line at 85% and another at 45%; without a breakdown by line, corrective action gets diluted across the whole scope instead of targeting the part that’s actually failing.
Treating OEE improvement as an end in itself. OEE is a diagnostic indicator, not a goal: a line can post an excellent OEE score while producing a volume nobody has ordered, which creates no real value. The indicator should always stay tied to a production target that makes commercial sense, not just a technical one.
Calculating OEE without ever connecting it to a management ritual that discusses its causes. The most common error on the shop floor. A board that displays an OEE score with no one meeting to analyze its root causes only documents a problem that’s already known, without ever pushing it back.
These three errors share the same root cause: they treat OEE as a result to display rather than a starting point to interrogate. A score, whatever it is, is only worth the decision it triggers the next morning.