
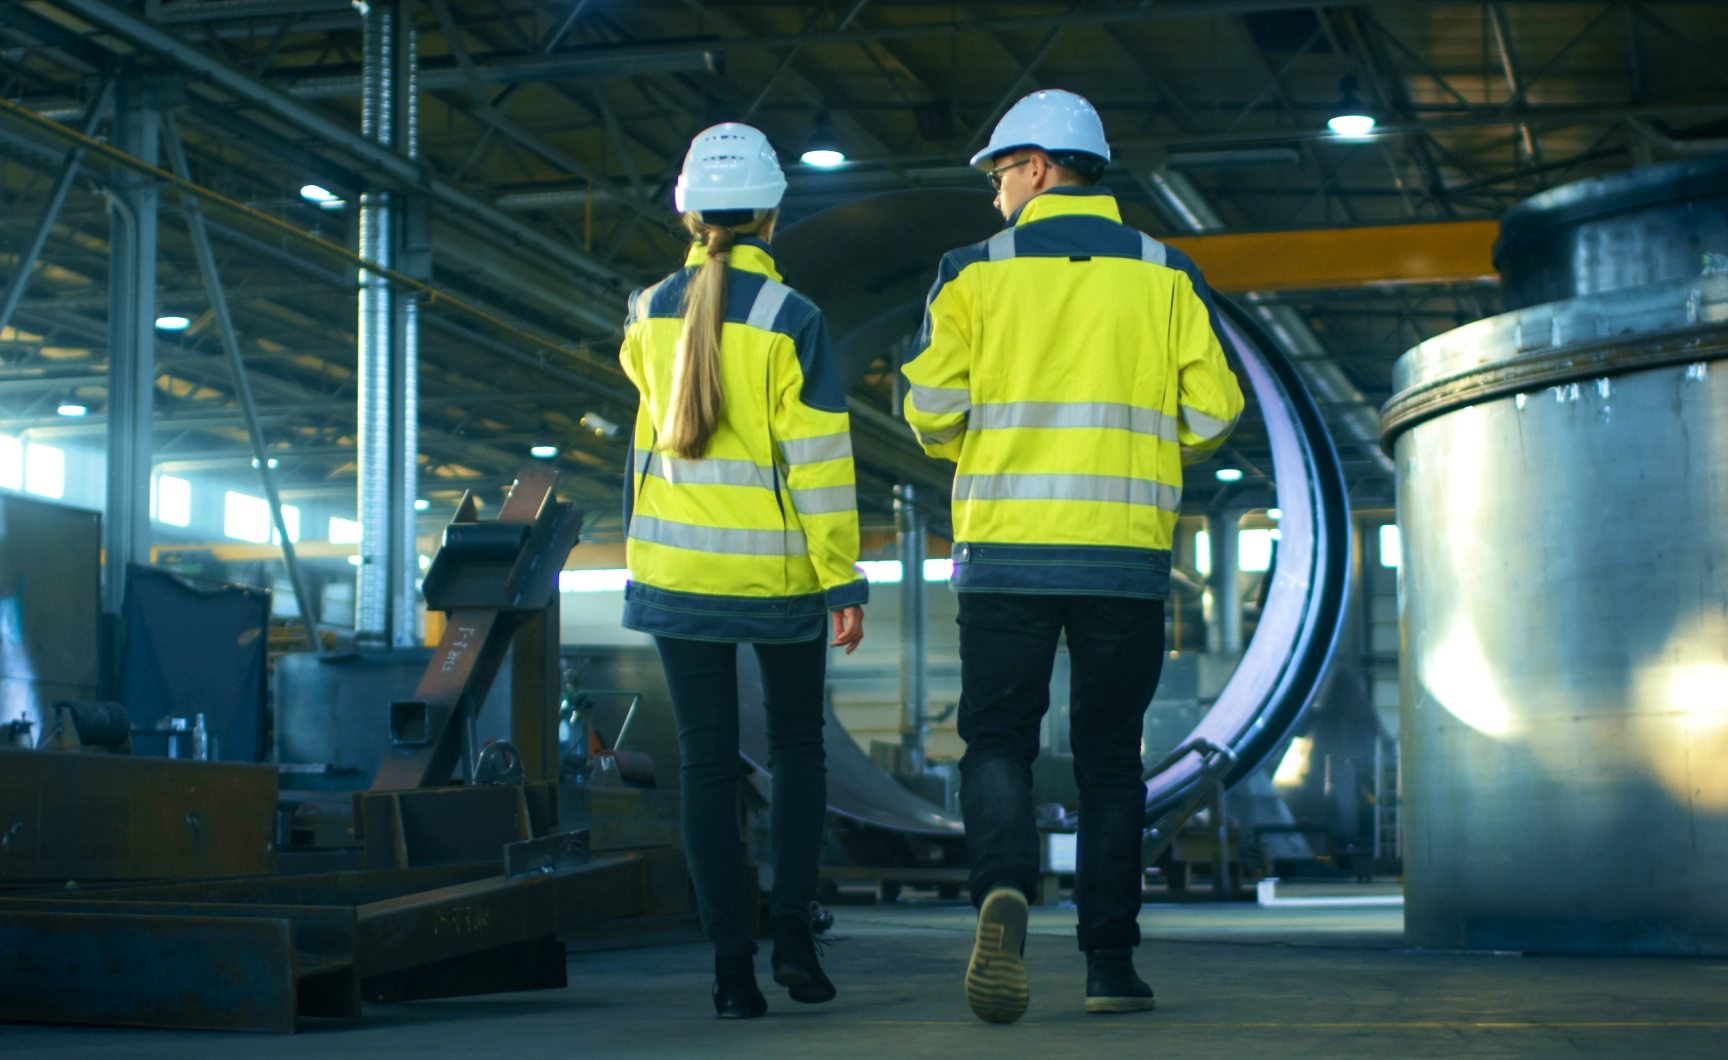
Une Obeya est une « grande salle » où la stratégie prend vie.

À l’origine, il s’agissait d’un espace physique dans les pratiques Lean, et aujourd’hui les espaces physiques et numériques se combinent.
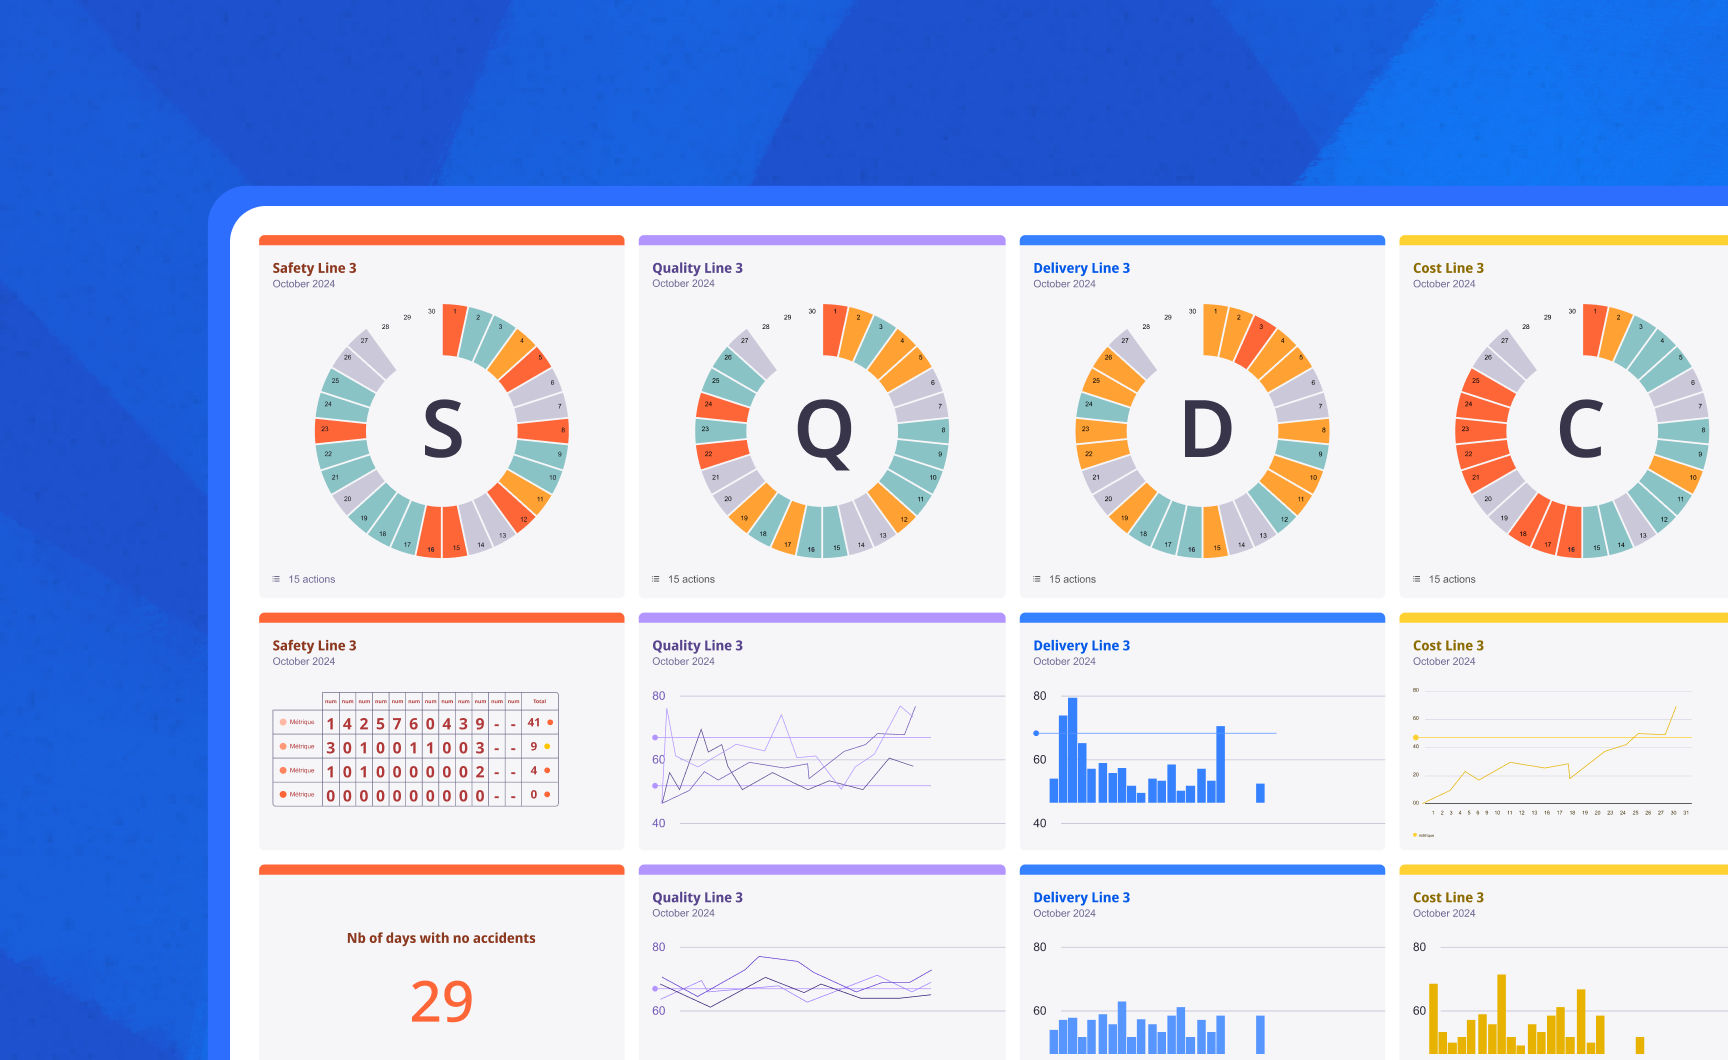
Dans l’Obeya, les objectifs, les progrès et les défis sont rendus visibles afin que les dirigeants et les équipes puissent s’aligner, partager des informations et agir rapidement.
Cette clarté accélère la prise de décision et permet de transformer la stratégie en résultats.
Plus qu’une simple salle, l’Obeya est une manière de travailler.
Elle renforce la confiance, la concentration et la collaboration.
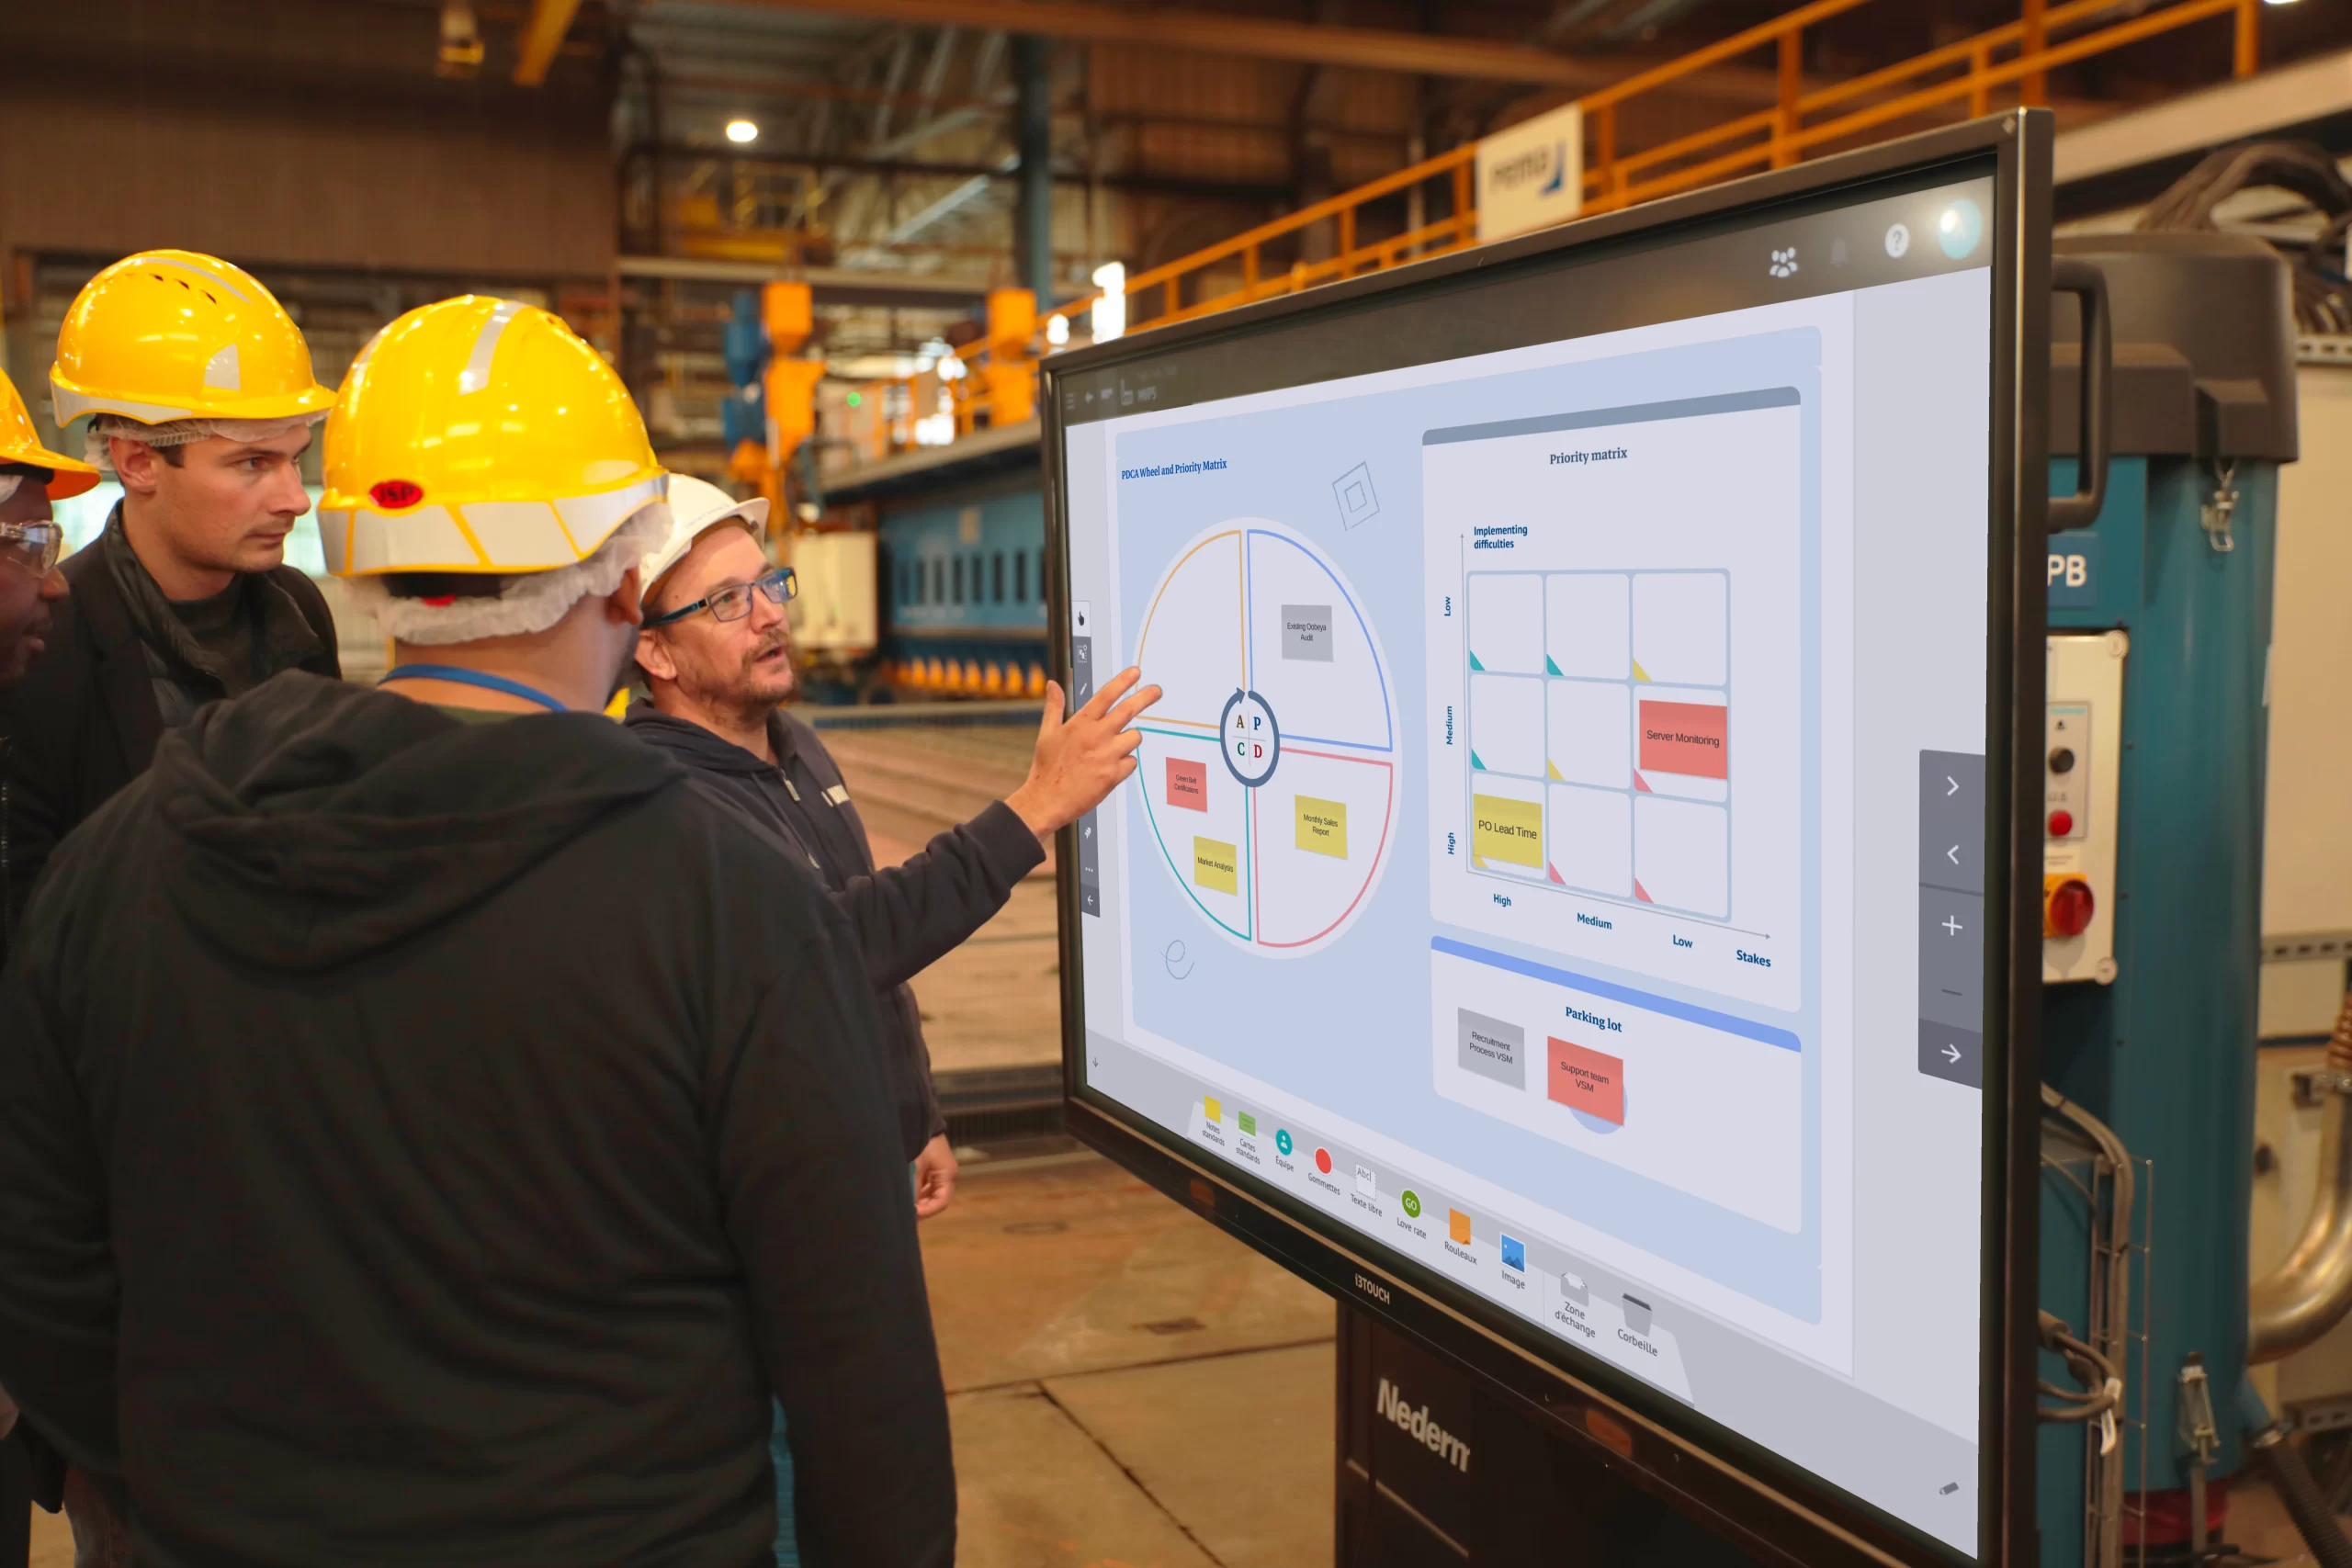
Elle connecte les dirigeants aux équipes en temps réel.
Chacun voit la vision globale, avance dans la même direction et contribue au succès commun.