


- Home
- Lean Corner
- KPI Design for Operational Excellence: How to Choose Three Indicators That Actually Drive Decisions
KPI Design for Operational Excellence: How to Choose Three Indicators That Actually Drive Decisions
- The Overload Problem: What We Choose to Look at Determines What We Decide
- Customer Satisfaction as the Engine of Shop-Floor Indicators
- A Selection Framework in Three Questions
- The Three Most Common Mistakes
- The Decision Test: One Question Per Indicator on Your Board
- A KPI Architecture by Level: What Goes Where
- Managing the Indicator Architecture Across a Multi-Site Network
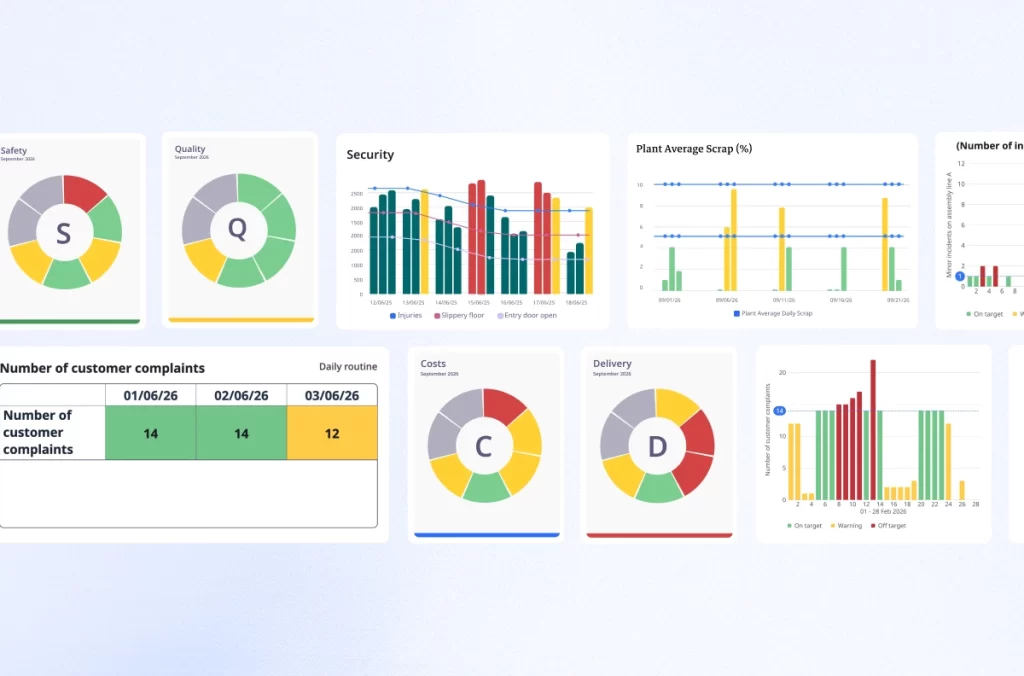
The daily management meetings that work share one thing: within thirty seconds in front of the board, the team leader knows exactly what requires action today and why. The ones that do not work share something else: a board overloaded with numbers, a meeting that runs long as each metric is read aloud, and a room that disperses without a decision made.
The difference is almost never a question of effort. It is almost always a question of starting point: what did you design your indicators from?
The Overload Problem: What We Choose to Look at Determines What We Decide
There is a simple rule, often ignored in board design: what we choose to look at determines what we decide. If the only priority indicator is unit processing cost, a surge in demand delights the business unit costs fall, everything looks fine. Until workplace accidents and customer complaints flash red. Too late.
This is the fundamental paradox of most SQCDP boards: we measure abundantly what happens inside, and very little of what the customer experiences outside. Each dimension –( Safety, Quality, Cost, Delivery, People) — tracks between eight and fifteen metrics daily. Teams can tell you equipment utilization rates, absenteeism, energy cost per unit, and a dozen other things. What they cannot tell you, in five seconds, is the single thing degrading their customers’ experience this morning.
Customer satisfaction should be the starting point of any indicator architecture, not its endpoint. A board no one can read in thirty seconds, and that never mentions the customer once, is not a management tool; it is a reporting table.
Customer Satisfaction as the Engine of Shop-Floor Indicators
I visited an industrial site that had solved this problem in a remarkably simple way. After every customer delivery, a satisfaction survey was sent. The results produced two things: a score out of ten and verbatim comments. The rule was clear: below eight out of ten, a problem-solving process was immediately triggered. Above eight, but with a verbatim that kept recurring (the same complaint, the same friction, worded differently each time) a deeper problem-solving process was launched
This system contrasts sharply with a widespread mistake. A large bank believed it was performing well: client appointments doubled, product sales up, NPS positive. But recovering a lost bank card took two months: 45-minute queues, a broken IT system, an unreachable advisor. The NPS was measured twice a year via a long questionnaire: it captured nothing of what the customer actually lived day to day. A satisfaction measure that is too aggregated and too infrequent is blind to real friction.
The difference between the two approaches is structural: in the first case, measurement is frequent, granular, and directly linked to action. In the second, it is consolidated, rare, and disconnected from the floor. It is that frequency and granularity that allow a customer signal to be linked to a precise indicator on the board; processing lead time, number of orders behind plan in the shift, number of open anomalies since the start of the day.
A Selection Framework in Three Questions
Before adding an indicator to a daily management board, three questions.
First question: if this indicator deviates, does it translate into an identifiable degradation for the customer? An equipment utilization rate that drops may signal an internal issue without the customer feeling any impact whatsoever. A processing lead time that slips by two days always reaches the customer. Prioritize indicators whose deviation has a direct path to the customer experience.
Second question: can the person running the meeting act on it within the current shift? If the team leader cannot influence the number before the next meeting, the indicator belongs to Tier 2 or Tier 3, not a Tier 1 board. Placing it at Tier 1 turns the meeting into a reporting exercise.
Third question: is this indicator already correlated with another on the board? If two indicators move together, one is redundant. Keep the one closest to the customer experience; remove the other.
An indicator’s role is not to close a discussion, it is to open one. A board that gives answers is a reporting table. A board that asks questions is a management tool. Apply these three questions to each indicator until you reach three to four per dimension. That is the design target, not a compromise.
The Three Most Common Mistakes
Mistake 1: lagging indicators disguised as leading ones. The most common version: tracking last week’s service rate on a board designed to drive today’s decisions. A rate calculated over seven days tells you what happened. It does not tell you what to do this morning. The right substitute: the number of orders behind plan from the previous shift; a number the team leader can correct before the next break.
Mistake 2: compliance indicators with no action lever. An audit score. A training completion rate. The test: can anyone in the room change that number today? In most cases, no. These metrics belong in a monthly review. Putting them on a daily board teaches teams that the board is for reporting, not action.
Mistake 3: aggregated indicators that hide the signal. An overall OEE combining three lines with very different profiles. When it goes red, no one knows which line is pulling the variance. The right substitute: track each line separately. As soon as an indicator goes red, the action is immediate and obvious.
The Decision Test: One Question Per Indicator on Your Board
For each indicator displayed, one question only: “If this number went red today, what would the team leader do concretely?” Answer in five seconds. If the answer requires reflection, the indicator is not doing its job. A true key indicator produces an immediate, automatic response: the team leader knows exactly which action follows a red signal, because the indicator was designed with that action in mind.
A variant to add systematically: “And if this indicator deviated for three consecutive shifts, which customer would suffer, and how?” If no one can answer, the indicator is disconnected from customer reality.
Run this test at your next board review, without announcing it in advance. Roughly one third of indicators on a typical SQCDP board will fail. Remove them. Teams will not miss the information. They will miss the noise.
A KPI Architecture by Level: What Goes Where
Toyota has long applied a simple logic in its management rooms: Quality, Cost, Delivery; three dimensions, unambiguous status. Green means the situation is under control or adequate countermeasures are in place. Red means a problem is open. Two states, not five. This is the antithesis of the fifteen-metrics-per-dimension board, and it is precisely what three indicators per level means in practice.
Tier 1: operator and team leader: three to four leading indicators actionable within a single shift. Number of orders behind the shift plan. Number of open escalated anomalies not yet closed. Processing lead time per hour. Numbers that, if they drift, risk producing a customer score below eight.
Tier 2: line manager and continuous improvement lead: three to four lagging indicators that aggregate Tier 1 performance. Internal customer service rate. Plan adherence rate by line. This is also the level where recurring customer verbatims are analyzed: the same complaint across three consecutive deliveries triggers a structured problem-solving process.
Tier 3: site director: two to three strategic KPIs connected to Hoshin Kanri objectives and the long-term evolution of customer satisfaction. The connection must be traceable: a Tier 1 indicator must be readable as a contribution to a Tier 2 indicator, which connects to a Tier 3 objective and, ultimately, to a customer score. If that traceability does not exist, the cascade is broken.
Managing the Indicator Architecture Across a Multi-Site Network
On a single site, this architecture is manageable informally. The site director knows the context and can see when an indicator has drifted from its customer connection. Across five or ten sites, the problem changes in nature: how do you know whether the Tier 1 indicators in Lyon are still built from the same customer logic as those in Bordeaux, and whether the Tier 1 to Tier 3 cascade is intact everywhere?
iObeya connects the SQCDP boards and Hoshin Kanri objectives of each site in a shared digital environment, so the site director can verify whether the indicator architecture is consistent across the network and whether customer signals are flowing all the way up to the level where structural decisions are made. The relevant question is not “do we have digital boards”? It is “can we trace a floor-level signal to a strategic decision, across every site, from a single view?”
For the selection criteria of a multi-site visual management platform, see our dedicated guide.