

- Home
- Lean Corner
- How to Connect Your Annual Strategy to Monday’s SQCDP Meeting
How to Connect Your Annual Strategy to Monday’s SQCDP Meeting
In October the site committed to a quality breakthrough. By March the commitment exists in three places: a slide in the strategy deck, a line in the department review pack, and a number nobody on the floor has seen. The board on the main line has not changed since last year.
Nothing has gone wrong yet. The objective is sound, the board is well run, and the team leader is doing the job as defined. The failure is that no one was ever asked to connect the two, so no one did.
This is the gap between a Hoshin Kanri deployment, which runs in annual and quarterly cycles, and an SQCDP board, which runs in 24-hour cycles.
A few definitions first. SQCDP (Safety, Quality, Cost, Delivery, People) is a daily management board, run at the line level: the Tier 1 meeting brings the team leader and operators together for 15 minutes; the Tier 2 meeting then aggregates inputs between the line manager and team leaders. The site director who deploys a Hoshin Kanri is generally familiar with both rituals. What they have not necessarily resolved is the connection between them.
The Gap: Strategy Is in a PowerPoint, SQCDP Is on a Board
Imagine the site director on Monday morning, standing in front of the SQCDP board on their main line. Safety green, Quality red, Costs trending slightly negative, Delivery to watch. They know, because they designed it, that this year’s Hoshin objective centres on a quality breakthrough: reduce the customer defect rate by 40%. Yet nothing on that board tells them whether what the team is doing this morning is moving toward or away from that objective. The Quality cell is red because Friday’s scrap rate was 4.2% against a target of 3%.
The image that captures this situation is two virtual clocks in the same building, set to different time zones. Hoshin runs in annual and quarterly cycles. SQCDP runs in 24-hour cycles. Nobody has synchronised them.
What should be true in any organisation running both tools can be stated simply: the vision is identical at every level, and every team knows precisely how its daily contribution connects to the objectives of the level above. This principle is at the heart of any serious Hoshin deployment. It is rarely achieved beyond the department level, and even more rarely traced all the way to Monday morning’s board.
The Cascade Mechanism: From Breakthrough Objective to Tier 1 KPI
Context for the example: industrial manufacturer, three production lines, objective: “Reduce the customer defect rate by 40% over the year.”
- Break the objective down into department KPIs during catchbal. A global 40% reduction target masks very different realities depending on whether a line starts at 85% or 72% of first-pass conformance. Additionally, not all lines need to carry the same volume. Assuming Line A has 50% of the volume, line B 30%, and line C 20%. We define three distinct commitments: Line A from 72% to 83%, Line B from 85% to 90%, Line C from 81% to 88%. Three specific, assigned trajectories, not a global intention.
- Translate into a team-level leading indicator. Central question: what can a team leader do in a shift to move that rate forward tomorrow? On Line A, the identified problem is that non-conforming parts are leaving operation 3 undetected and generating rework at the end of the line. The Tier 1 leading indicator becomes the number of non-conforming parts passing from operation 3 to operation 4 without being detected, counted per shift. This is a number to drive down to zero, and one the team leader can directly influence by tightening the control at the output of operation 3.
- Add the indicator to the SQCDP board.The Q dimension gains a column: “Non-conforming parts passed to the next step, target: 0 per shift.” Green if 0, red above. This is not an additional indicator: it is a replacement. The old global scrap rate (a lagging indicator) is moved to Tier 2.
- Define the Tier 2 reconnection cadence.Each month, the Tier 2 review aggregates the per-shift counts and compares them to the monthly conformance rate. If Tier 1 behaviour is good (zero or near-zero non-conforming parts passing through) but the rate is not improving, there is a structural problem to investigate, not a team behaviour problem. This review closes the loop.
Two Failure Points and How to Avoid Them
- Failure point 1: the leading indicator is a lagging indicator in disguise.“Number of non-conforming parts this week” instead of this month: same logic, shorter window. Test to apply consistently: “Can a team leader change this figure in the next shift?” If not, return to the translation step.
- Failure point 2: the cascade loses strategic intent along the way.The team leader tracks their part count without knowing it is the key to a customer objective set in October. Fix: document the cascade chain explicitly (breakthrough objective to department KPI to Tier 1 indicator) on an A3 or a reference document accessible to the team. This document is reviewed quarterly in Tier 2 reviews, and team leaders must have seen it at launch.
What This Looks Like Across a Multi-Site Network
On a single site, the cascade can be maintained manually. Across several sites, the problem changes in nature: how do you know whether Lyon is using the same leading indicator as Bordeaux, and whether one of the two has drifted without anyone noticing? On one site, it is an organisational design problem. On five sites, it is an infrastructure problem.
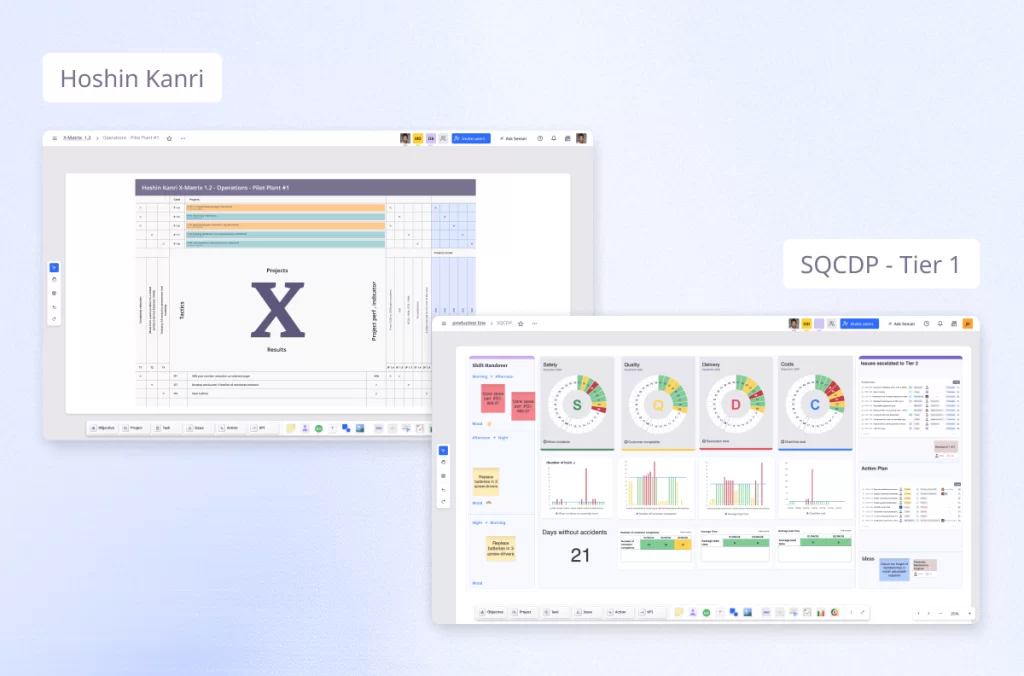
iObeya connects the Hoshin Kanri objective directly to the SQCDP board so the site director can verify that the chain objective → department KPI → Tier 1 indicator is intact across every site without travelling. The relevant question is not “do we have a digital Hoshin Kanri” but “can we trace a strategic priority all the way to Monday morning’s board, whatever the site?”
For platform selection criteria, see our dedicated article on Hoshin Kanri software.