

WADE matrix
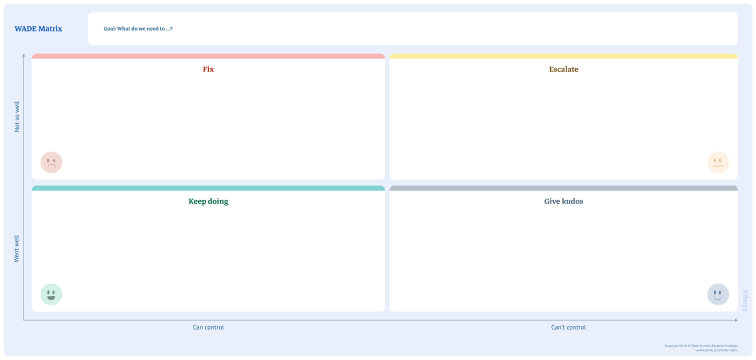
What is a WADE matrix? The WADE (What, Analog, Digital and Execute) matrix is a retrospective tool which follows a process allowing teams to prioritize problems and opportunities using four different categories: – Keep doing: Items in this category are activities or practices that are working well and should be maintained. These are often the […]
Starfish
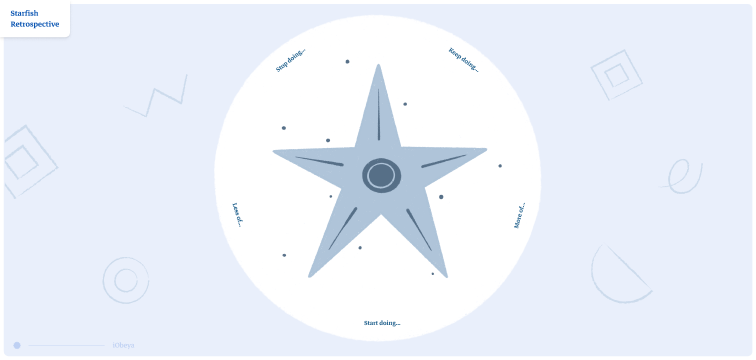
What is a starfish retrospective? A starfish retrospective is a tool that allows you to reflect on the progress made by a team while providing areas for improvement. To set up the analysis, the team discusses five categories of topics, visually represented by the five “arms” of the starfish: What is negative for the team […]
PESTEL analysis
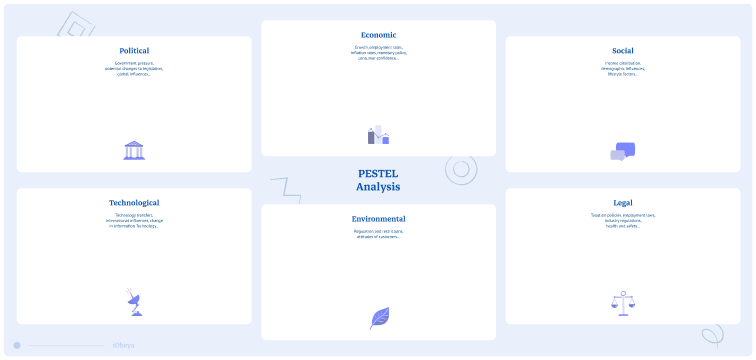
What is a PESTEL? PESTEL is a method of analysis that aims to assess the political, economic, social, technological, environmental and legal climate in which an activity or project will be developed. PESTEL stands for: Political Economic Sociological Technological Environmental Legal This method consists in studying these 6 factors of external opportunities or threats around […]
7 Wastes
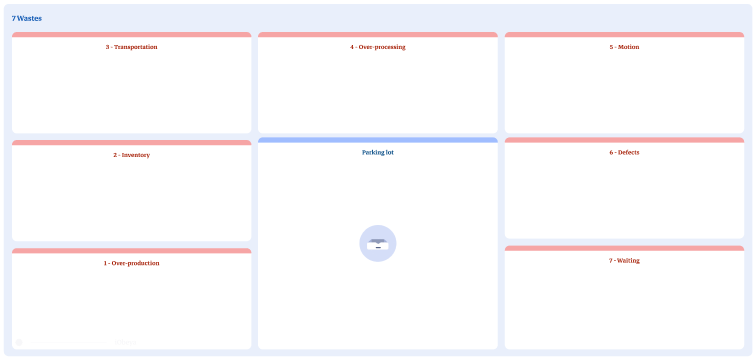
What are the 7 wastes of Lean? The 7 wastes is one of the main problem solving tools in Lean manufacturing. This tool identifies different factors that hinder the production efficiency and therefore profitability of a product. To do this, seven categories of waste are identified and analyzed in order to optimize the product and […]
Ishikawa
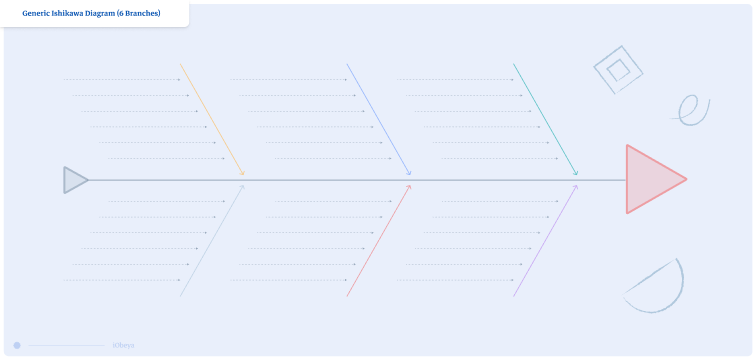
What is an Ishikawa? The Ishikawa diagram, also known as a fishbone diagram or cause-and-effect diagram, was coined by Kaoru Ishikawa, a well-known Japanese quality management specialist. His intention was to identify the root causes of a problem or event by organizing and analyzing information in a visual manner. Because of its design, the model […]
5W2H (WWWWHHW)
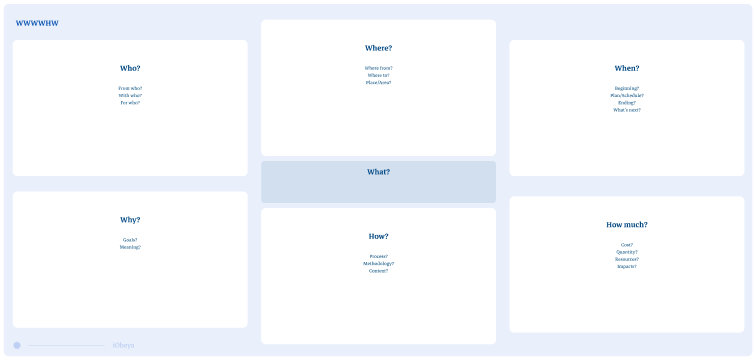
What is the WWWWHHW board? The WWWWHHW (5W2H) is a simple yet very effective problem solving method. It accurately and exhaustively diagnoses a situation or a problem. During a brainstorming session using the WWWWHHW method, answer the following questions: What is the problem? Who is involved? Where does it happen? When is this problem triggered? […]
Risk matrix
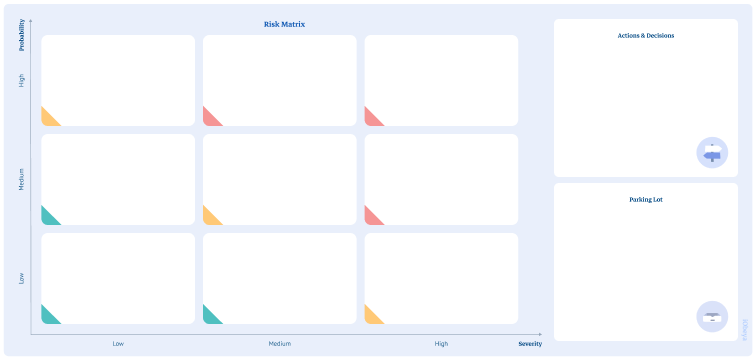
What is a Risk matrix? A Risk Matrix is used to identify the threats that a project may face. The aim of this matrix is to identify but also to address these threats depending on their severity. To define the risk level of an element, the analysis model is structured with two axes: A horizontal […]
OKR board
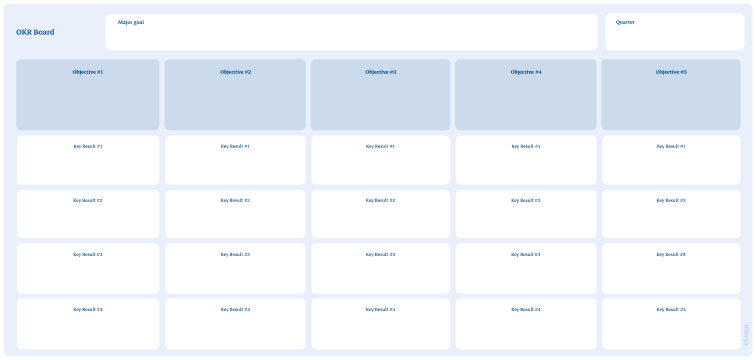
What is an OKR board in iObeya? An OKR board is a Visual Management tool that allows you to track and display the Objectives and Key Results (OKR) of an organization, a team, or an individual. OKRs are widely used for performance management and goal setting. An OKR board is a physical or digital board […]
Risk matrix weighted
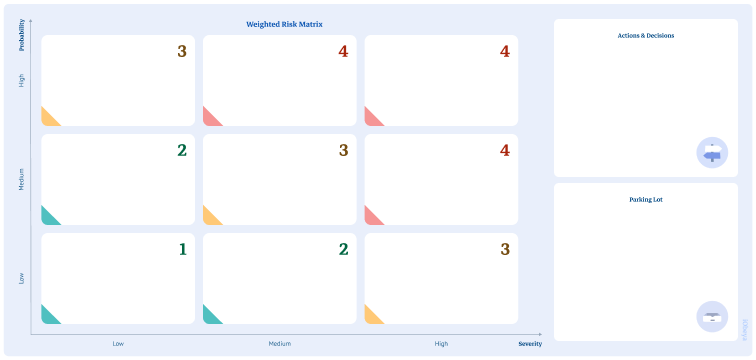
What is a Weighted Risk Matrix? A Weighted Risk Matrix, also known as a risk assessment matrix or risk prioritization matrix, is used to identify the threats that a project may face. This matrix visually represents risks to identify and address these threats depending on their severity and likelihood. To define the risk level of […]
PICK matrix
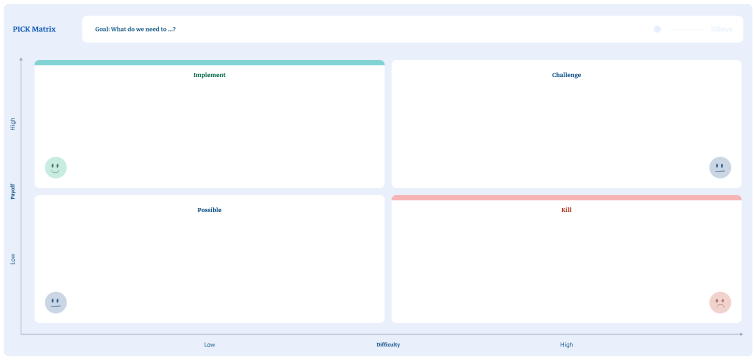
What is a PICK matrix? A PICK matrix (Possible, Implement, Challenge, Kill) is a visual tool used in production, logistics, quality and similar management processes. The PICK matrix is often visually represented as a table with 4 categories related to each letter of the acronym: ● “Possible” items have the potential to improve the process […]