


Use case: SQCDP
Use case: SQCDP
Updated • August 2026
Run SQCDP
on boards that stay true between shifts
At six in the morning the D letter goes red, and the figure behind it was copied off a report printed the night before.
iObeya holds every letter, the indicators that colour it, and the action raised against it on one board that updates while the plant runs. SQCDP board software on the Digital Obeya Platform™.
Updated • October 2026
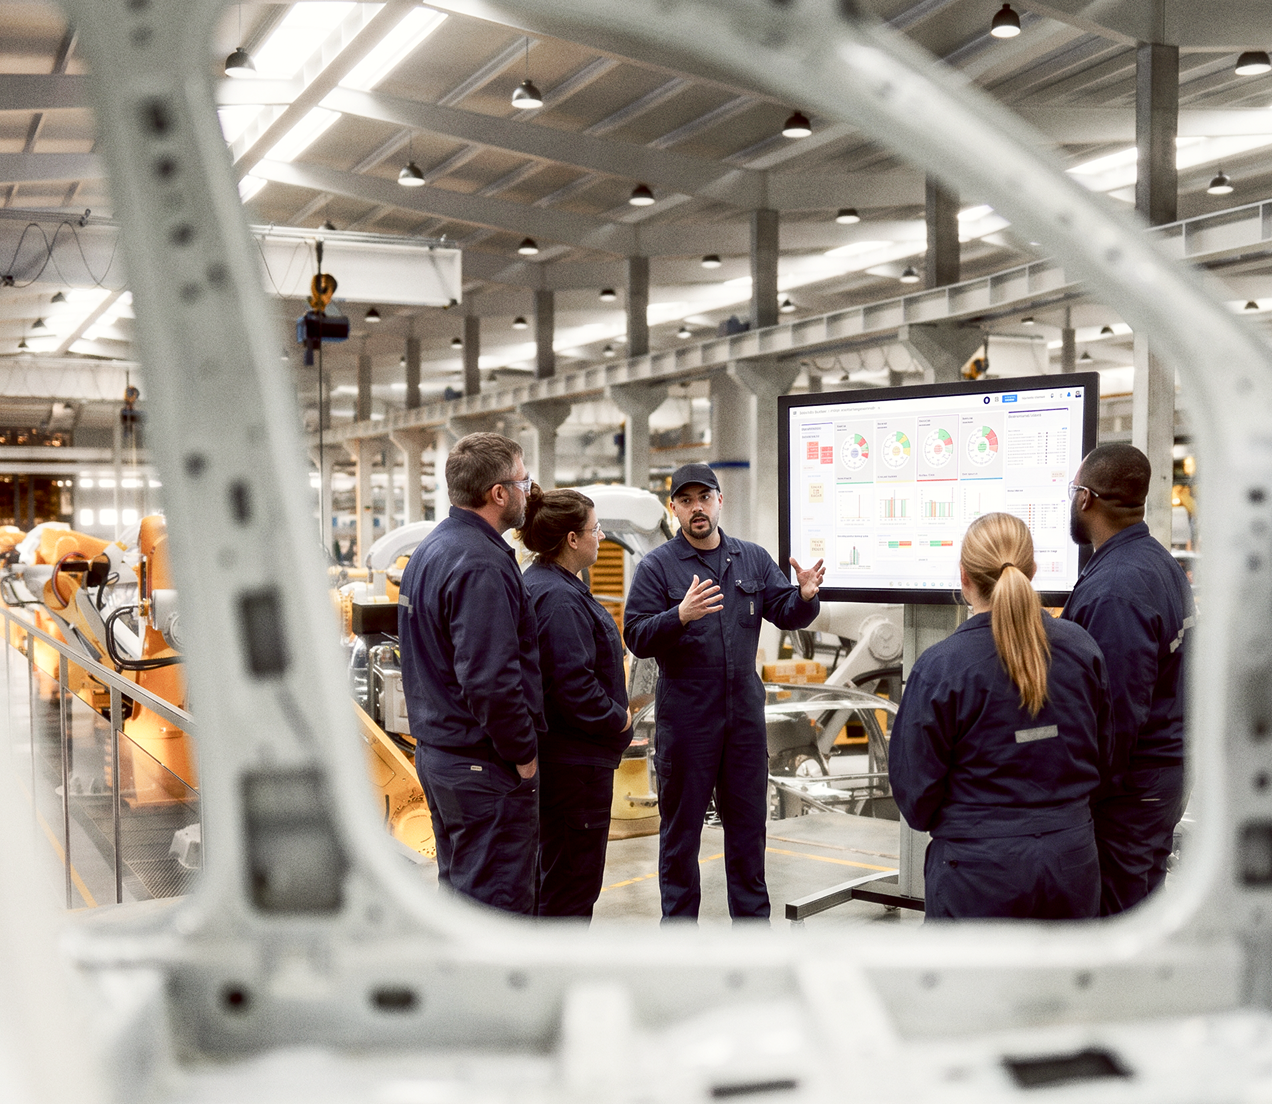
Trusted by global manufacturers running daily performance reviews across their sites
30 min of meeting preparation saved, per team, per week.
SQCDP is a daily routine, not a scoreboard
Five letters, and the indicators behind each one
Counted values such as scrap rate or on-time delivery, and observed ones such as a near miss or team climate. Each sits under a letter with its target, its threshold, and the history that lets a trend be read rather than guessed at.
From the shift team to the plant director
Team leaders and operators at the line, area and plant managers at the tiers above, and the operational excellence team that owns the definitions. Running in manufacturing plants, logistics sites, laboratories and maintenance depots.
Where the score stops and the work starts
A scoreboard records that Delivery went red; SQCDP is where the team settles who works it and by when, with what has already been tried still attached to the letter.
How SQCDP works in iObeya
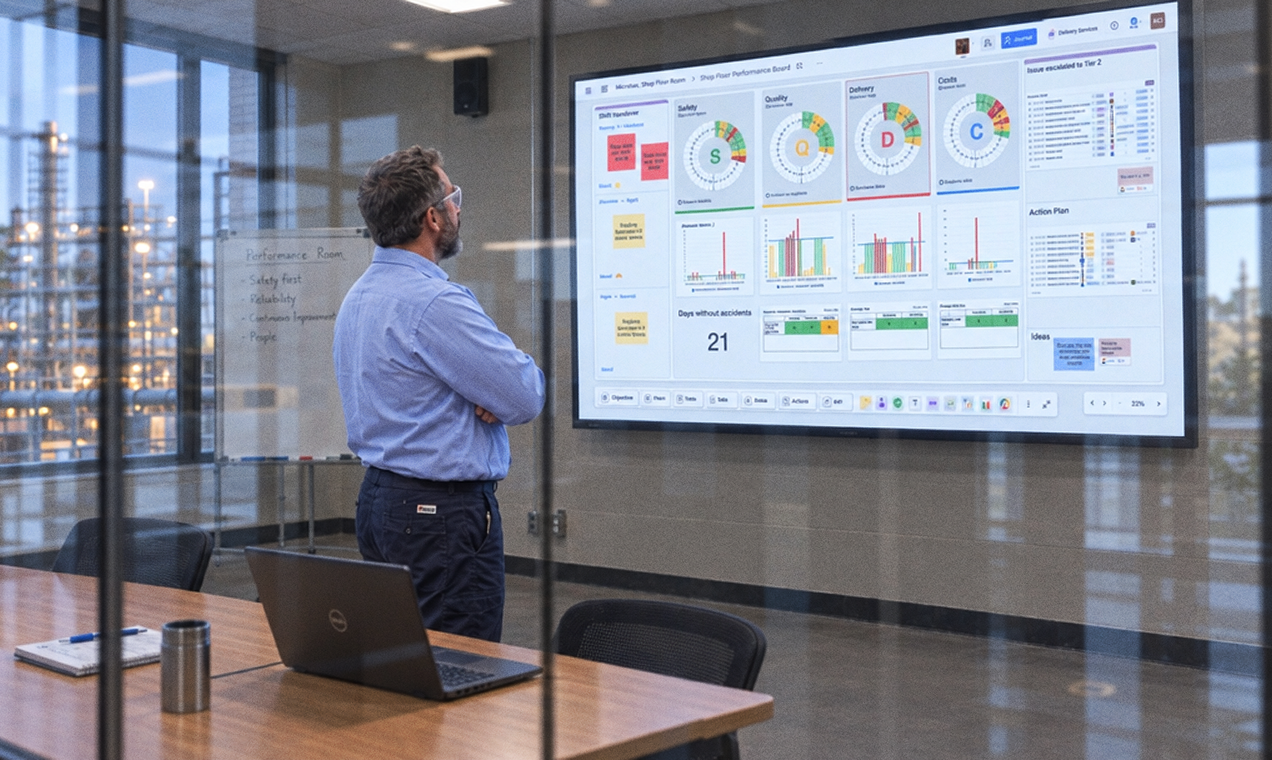
SQCDP rarely fails at the stand-up. It fails in the hour before it, when somebody transcribes last night’s figures onto a board that will already be out of date by the second shift. In iObeya the board is the system of record, so what the team stands in front of is what the plant is actually doing.

Every letter coloured by its own data
Each letter on the board holds its indicators, their targets and their thresholds. A value crossing a threshold changes the colour on its own, and the box opens onto the figure that moved it and the period it covers.
The meeting discusses about the cause instead of the colour.
Colouring by hand puts a judgement call in front of the team every morning. Somebody decides whether yesterday counts as amber, two shifts on the same line answer differently, and neither answer leaves a trace.
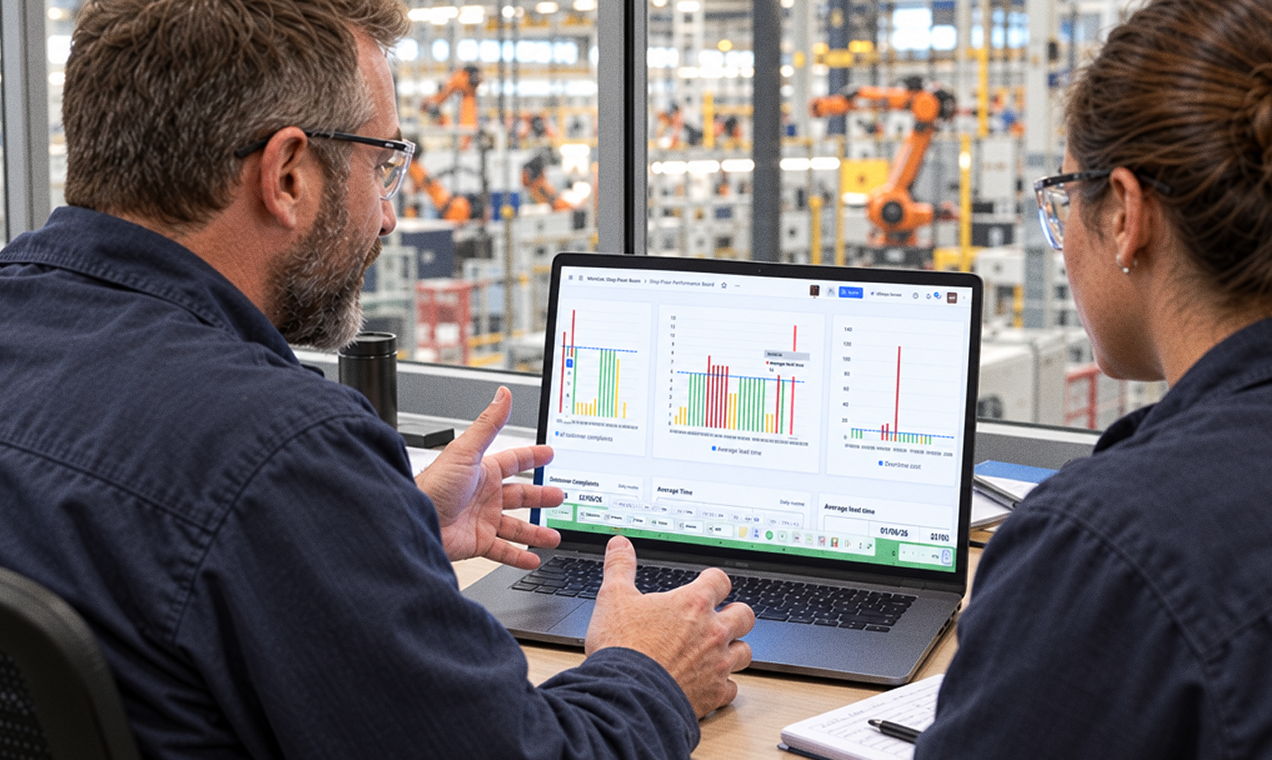
Quantitative, qualitative, and computed
Define an indicator once, as a count, a rate or a yes-no observation, then set the formula that derives it from other indicators. Values are historised as they are entered, so any window from the last shift to the last quarter reads as a trend.
Nobody needs to recalculate anything before the meeting. The results are visible in real-time.
Spreadsheets handle the calculation perfectly. What they cannot do is stay attached to the letter the team is standing in front of, so within a month the workbook and the board disagree and nobody is sure which one to believe.
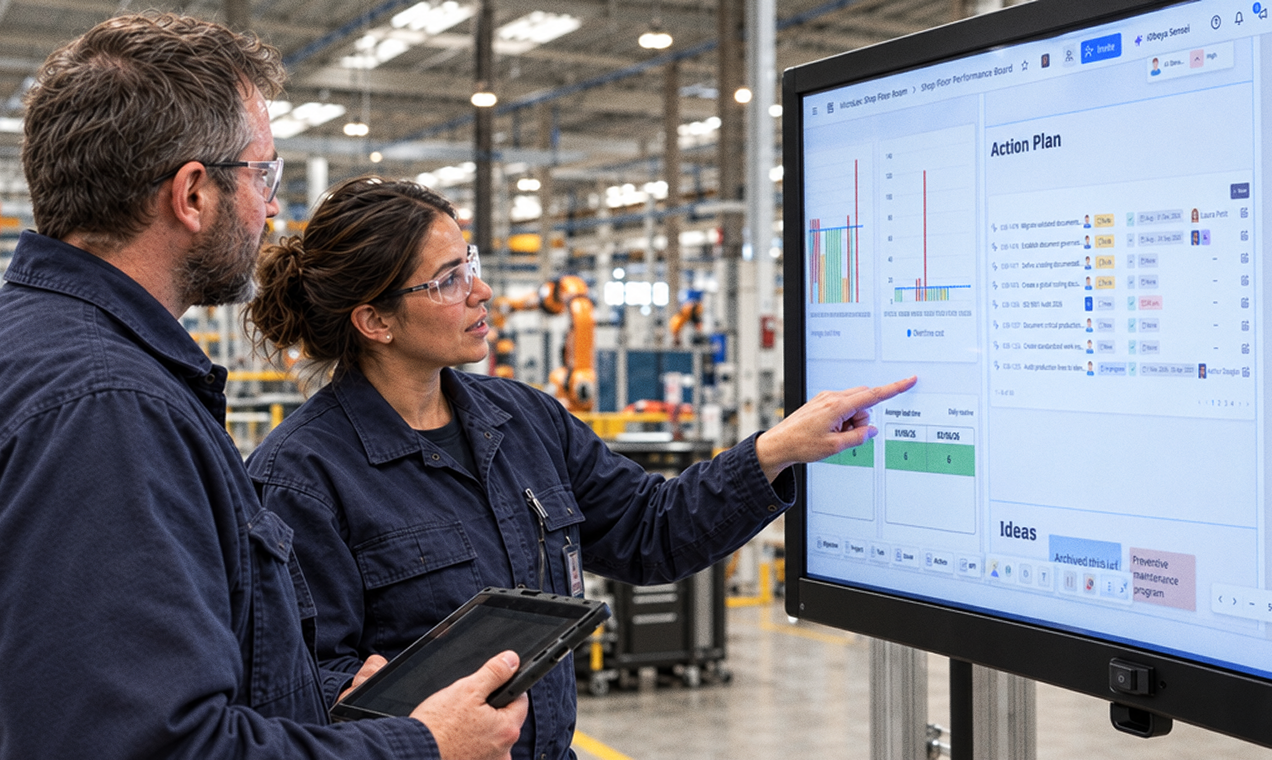
A red letter leaves the meeting with an owner
When a letter goes red, an action card opens against it carrying the problem, the countermeasure, the owner and the due date. The card stays attached to the indicator that triggered it and is never deleted, so what was already tried remains readable a year later.
Follow-up happens in front of the board, and the team that raised an action can follow it across the organization until it is closed.
Actions usually leave the board the moment they are agreed. They go into a spreadsheet, an inbox and somebody’s notebook, and the next review opens by working out which of the three is current.
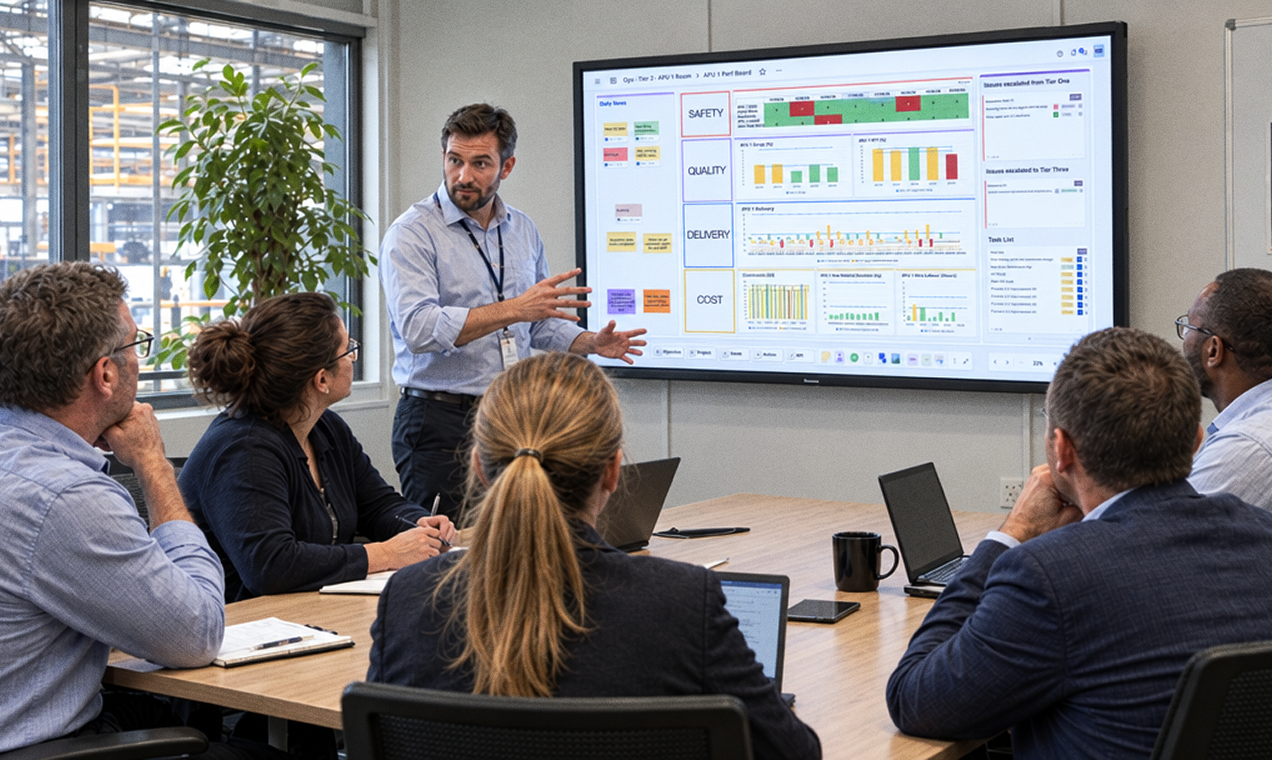
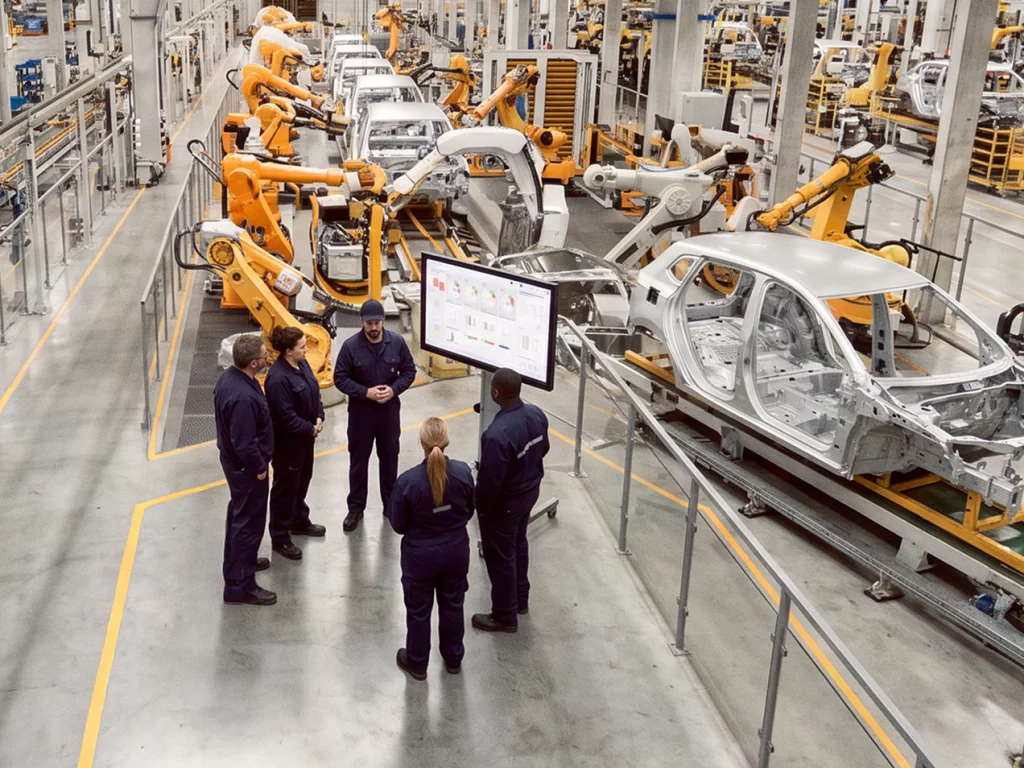
What Tier 1 cannot close moves up with its history
Where an action cannot be resolved at the level that raised it, it is escalated to the tier above and appears there with its indicator, its history and its owner intact. De-escalation runs the same path, so a decision taken at Tier 3 lands back on the board that asked the question.
The tier review meeting spends its time deciding and taking actions.
Without a connected system retelling loses detail. By the time a line problem reaches site leadership as a slide, the specifics that would have solved it have been summarised away, and the tier that can act is working from a paraphrase.
One indicator built from many
Build a tree of indicators by pointing a consolidated one at its sources. A source can sit on any letter, any board and any room on the platform, and the consolidated value moves as its sources do rather than waiting to be assembled.
The plant letter and the line letter are based on the same numbers, read at different heights.
A separate weekly consolidation file is a snapshot of a Friday. It answers a question asked on Monday with numbers that were true four days earlier, and reconciling it against the line boards takes longer than reading it.

Vaillant · Belper plant customer testimonial
The board a team will actually update
SQCDP board software usually asks the team to work its way round first: a field, a form, and a training session before anyone is allowed near a letter. Paper never asked for any of that. In iObeya a team leader walks up to the screen mid-huddle, changes the colour, writes on the card and moves it, without somebody explaining the interface first.
What paper could not do is remember. The colour keeps the value that caused it, the card keeps its owner and its history, and the trail underneath is built as the team works rather than reconstructed afterwards. Nothing is re-entered once the huddle breaks up, because nothing was only written down.
Not a shared whiteboard, and not a form somebody fills in after the meeting
One plant view, and a way back to the board behind it
In tiered daily management the figure a plant director looks at is an aggregate, and the moment it turns the only useful question is which line, which shift, and who is already on it. iObeya builds the consolidated letter out of its sources instead of out of a copy of them, so the plant view and the line board hold the same number at the same moment.
Selecting a consolidated indicator opens the boards that fed it, with the action cards already raised against them. Thresholds sit on consolidated indicators too, so leadership is alerted on the aggregate and arrives at the work rather than at a request for an explanation.
Not a reporting dashboard, and not an alert feed that hands you a number with none of the work attached
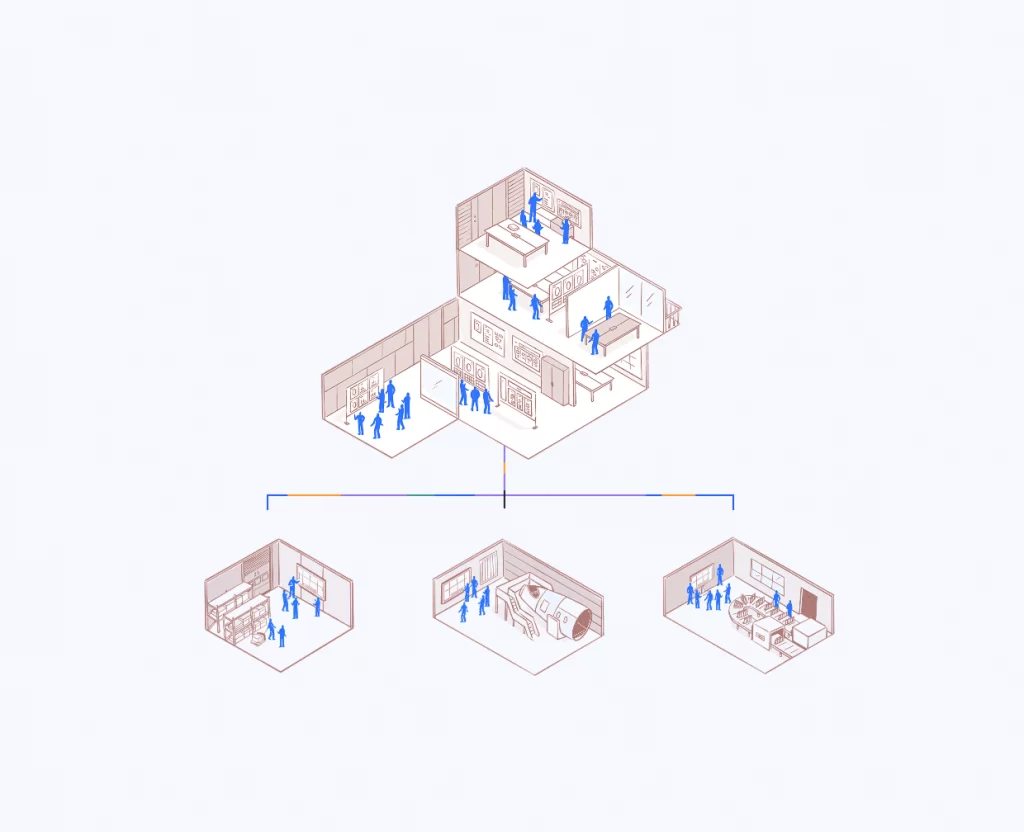
The same letters at every site, adapted locally
A digital daily management system only scales when a visiting manager can read another plant's board without a briefing first. In iObeya the structure is governed rather than copied: the letters, the indicator definitions behind them and the escalation path are held centrally, while each site keeps the line names, shift patterns and local indicators that make the routine fit its own floor.
Because the definitions are shared rather than duplicated, comparing two plants is a reading rather than a reconciliation exercise, and a group lead knows that Quality means the same thing in both. A new site starts from the standard instead of from a blank board, and the local adaptations stay visible as adaptations.
Not a template library, and not a corporate playbook nobody opens twice
Faster decisions,
and a payback you can put in the business case
across a six-year risk-adjusted model.
30 minutes
25%
20,000
“It is much easier to share a screen or room, it is much more transparent. Everyone knows information will be seen by leaders. Overall, escalation is 25% faster because we are able to include finance, supply chain, or others quickly and easily into the meeting, rather than emailing.”

Operational Excellence Leader, Sanofi
Sanofi iObeya testimony video
“We can instantly access all the site's performance indicators.”

Directeur de site, ID Logistics
iObeya x ID Logistics customer testimony
“Information rises more smoothly, and everyone contributes.”
Cabin Methods Manager, Chantiers de l'Atlantique
Chantiers de l'Atlantique iObeya testimony
Where to go next
Daily management system software
Short interval management software
How to structure a KPI tree
Complete daily management system guide
Continuous improvement
Improving operational visibility from the line to the top
Questions people ask about SQCDP
Safety, Quality, Cost, Delivery and People. Each letter is a performance dimension the team reviews every day, carrying its own indicators, its own target and its own threshold. Some sites order or name the letters differently, but the routine behind them is the same.
It gives a team one place to see how the shift performed against each dimension and to raise the work that corrects a deviation. A letter turns red, an action opens against it with an owner and a due date, and the review follows that action until it closes.
Whatever the team is actually accountable for. Typically incidents and near misses under S, scrap and non-conformances under Q, hours or cost per unit under C, on-time delivery or adherence under D, and absence, training or team climate under P. Both counted values and observations belong there.
They are variants of one routine. The letters change with the site, the industry and the language, and some groups add or drop a dimension. What stays constant is a daily review per dimension with a target, a threshold and an action raised when the threshold is crossed.
Yes, and the usual reason is that a spreadsheet cannot hold the follow-up. In iObeya the indicator, the colour it produces and the action raised against it sit in one place, so nothing is retyped between the shift board, the tier review and the plant summary.
A dashboard reports that a letter went red. A digital SQCDP board is where the team works it: the deviation becomes an action card with an owner, moves to the tier that can clear it, and closes in the same place the stand-up happens. iObeya also reads data from BI tools.
An action that cannot be resolved where it was raised is escalated to the tier above and arrives with its indicator, its history and its owner intact. De-escalation works the same way, so a decision made at Tier 3 returns to the board that raised the question.
They can. An indicator can be derived from other indicators by formula, and a consolidated indicator can draw its sources from any letter, any board and any room on the platform. Values are historised, so trends can be read over any window.