Lean Corner

Understand faster thanks to Leanpedia

Find clear definitions to align teams and support better daily operational decisions

3G

The 3Gs (Gemba, Gembutsu, Genjitsu) refer to three Japanese terms used in the context of Lean to encourage a direct and committed approach to continuous improvement. Gemba means “the actual place” where work is done, Gembutsu means “the actual object,” often referring to machines or products, and Genjitsu means “the actual facts” or actual data.
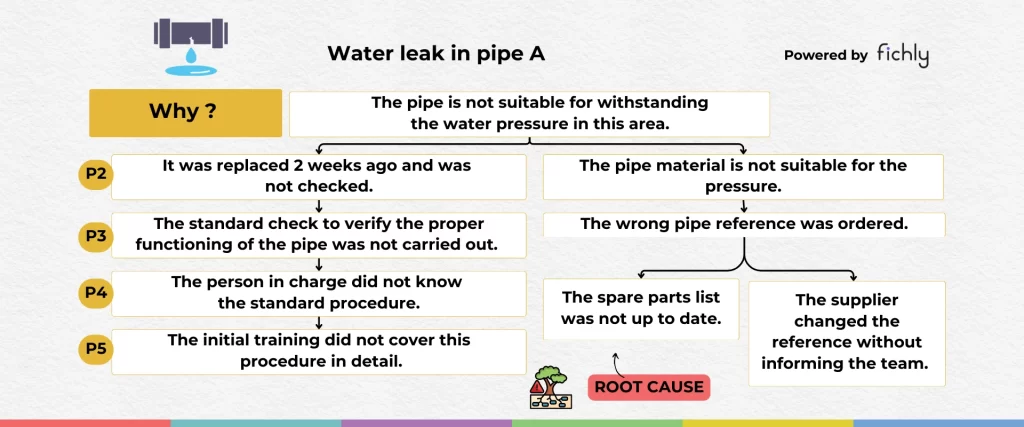
5 Whys diagram analysing a water leak in pipe A, with two branches of causes (missed check after replacement, wrong pipe reference ordered) leading to the root cause

5 Whys ?

The “5 Whys” is a root cause analysis technique that consists of asking the question “Why?” five times in succession (or more) to explore the causal chain of a specific problem. This simple tool helps uncover the underlying cause of a problem, avoiding superficial solutions that only address the symptoms.
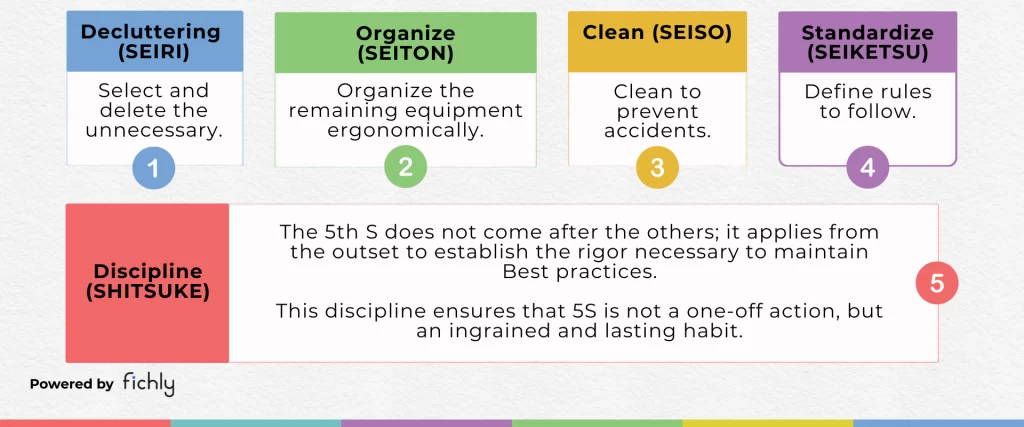
Diagram of the 5S method showing its five steps: Decluttering (Seiri), Organize (Seiton), Clean (Seiso), Standardize (Seiketsu) and Discipline (Shitsuke), the fifth applying from the outset

5S

The 5S method is an approach that aims to create and maintain an orderly, clean, and efficient workspace. Originally from Japan, it consists of five steps to be followed in the order indicated. This method can be applied to workshops and factories as well as to offices, service departments, and even your home.
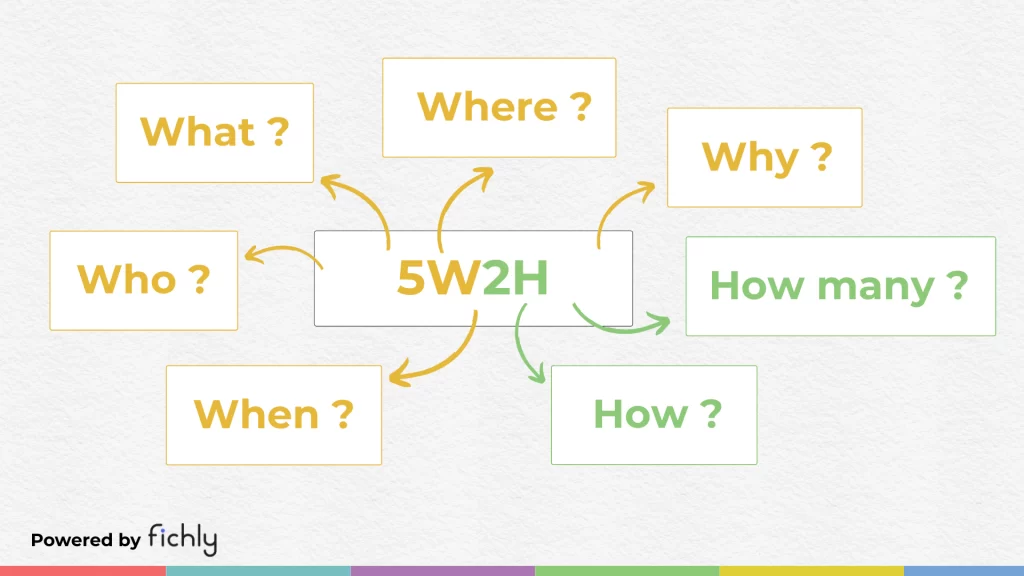
Diagram of the 5W2H method showing its seven questions around the acronym: Who, What, Where, When, How, How much and Why

5W2H

The 5W2H method is a structured analysis approach based on 7 questions: Who, What, Where, When, How, How many, and Why. It helps to understand a situation, solve a problem, or organize thinking by covering all key aspects. Simple and universal, it can be applied both in industry and in everyday life.
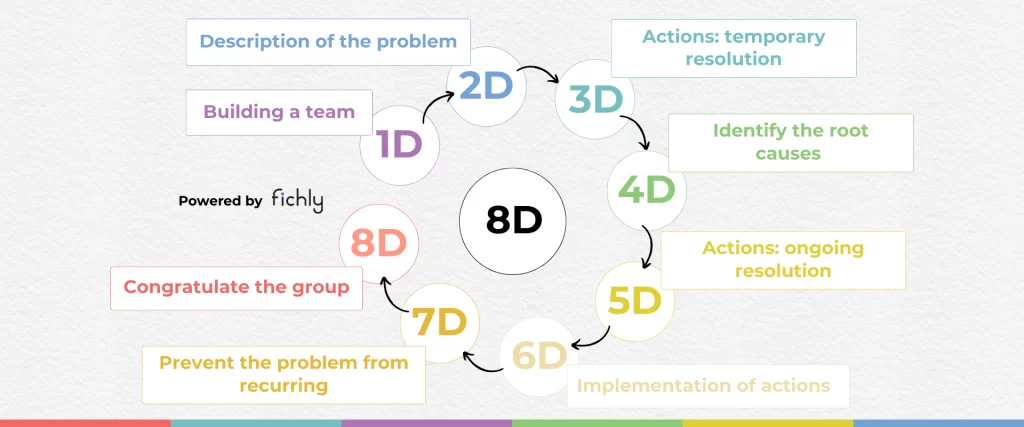
Circular diagram of the 8D problem-solving method showing its eight steps in sequence, from building a team (1D) to congratulating the group (8D)

8D

8D is an industrial problem-solving methodology that follows a rigorous eight-step process. It enables the methodical analysis of a quality issue, the identification of its root causes, and the implementation of sustainable solutions while capitalizing on the experience gained, thanks to a collaborative and documented approach.
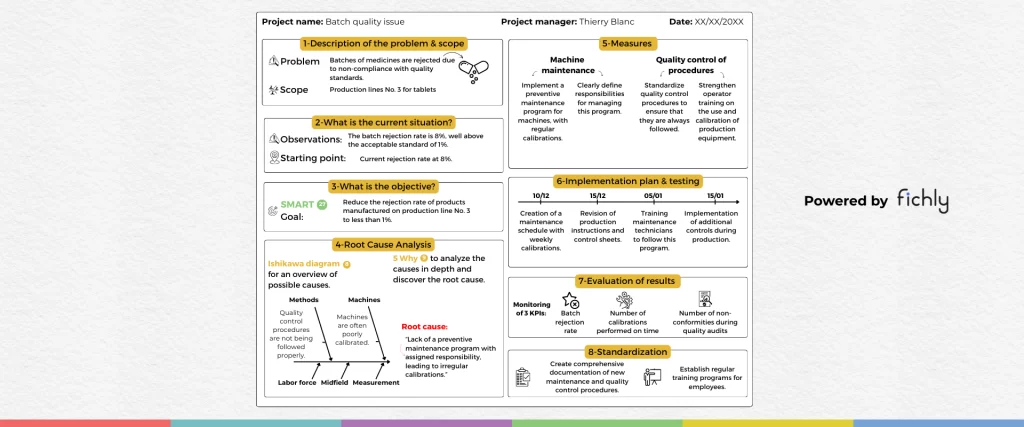
Example of a completed A3 report on a batch quality issue, with eight sections: problem and scope, current situation, objective, root cause analysis, measures, implementation plan, evaluation of results and standardization

A3

The A3 is a synthetic tool that consists of structuring and representing all the elements of a problem: his analysis, corrective actions, and corresponding action plan on a single page in order to prioritize effective visual communication.
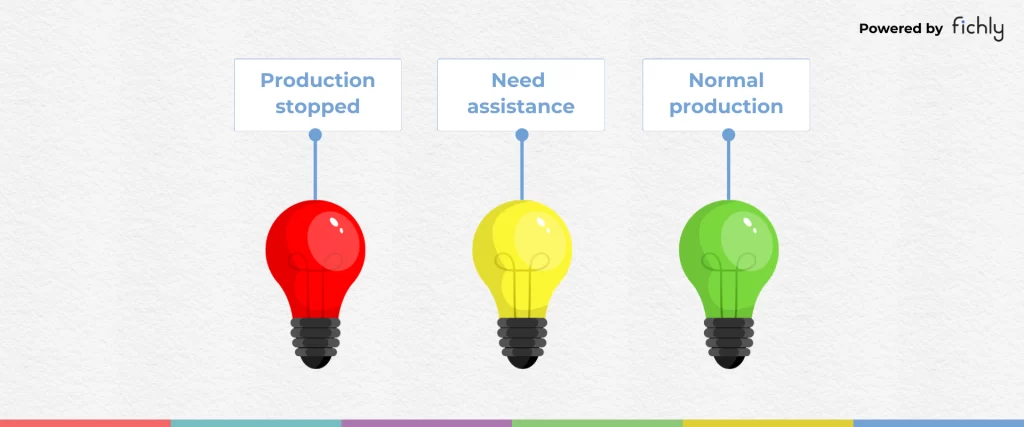
Three Andon light bulbs: red for production stopped, yellow for assistance needed, and green for normal production

Andon

Andon is a visual signaling system used on production lines to indicate the status of the process. It allows the production line to signal a failure to operators through a visual or sound signal, which alerts the maintenance team or supervisors. It can be activated manually or automatically through thresholds.
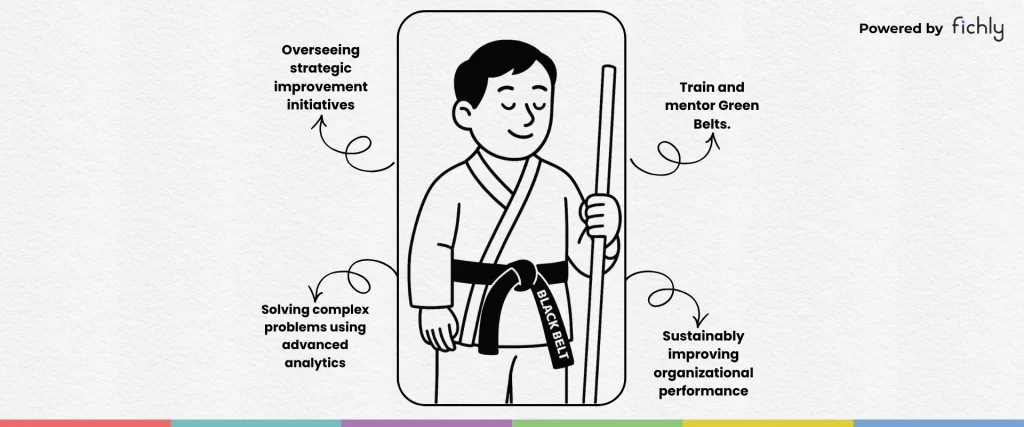
Illustration of a Lean Six Sigma Black Belt in a martial arts uniform with four key responsibilities: overseeing strategic improvement initiatives, training and mentoring Green Belts, solving complex problems with advanced analytics, and sustainably improving organizational performance

Black Belt

The Black Belt corresponds to a high level of expertise in continuous improvement. Black Belts lead high-impact strategic projects using advanced methods of analysis and problem solving. They support teams in process transformation, train and coach Green and Yellow Belts, and contribute to the sustainable dissemination of Lean culture within the organization.
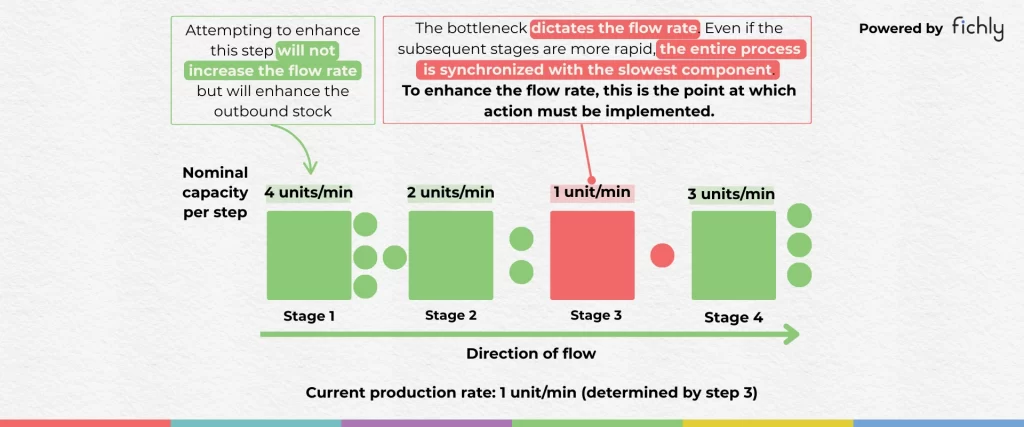
Diagram of a four-stage production line where stage 3, the bottleneck at 1 unit per minute, limits the whole process, even though the other stages have higher capacity

Bottleneck

The bottleneck is the slowest stage in a process. Like a pinched pipe that slows down the flow of water, it slows down the entire flow, even if the other stages are fast. It limits the overall pace. To increase output, you must first identify and relieve this bottleneck: this is where the gains are most visible and immediate for the entire process.
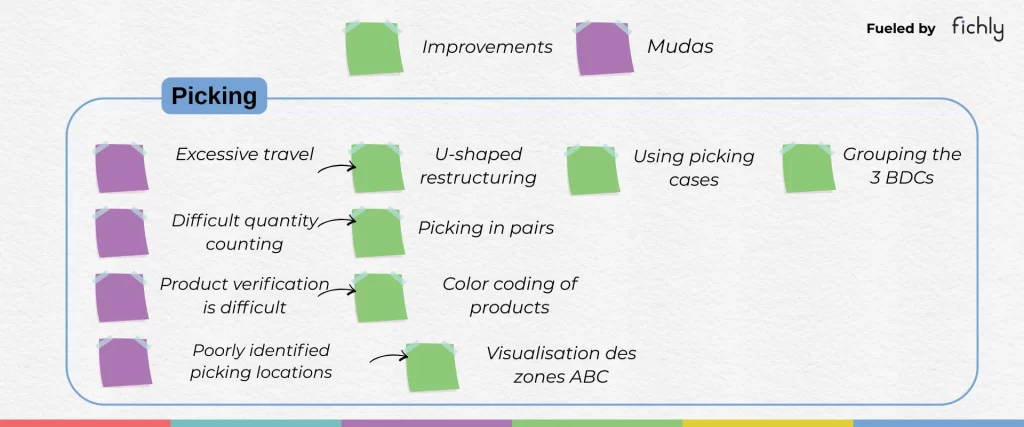
Brainstorming board for a picking area, with purple sticky notes for wastes (excessive travel, difficult quantity counting, hard product verification, poorly identified locations) linked to green sticky notes for improvements

Brainstorming

Brainstorming is a collective creativity technique that involves generating as many ideas as possible around a given problem or topic. Used in Lean during the analysis or solution-finding phases, it encourages all team members to participate, without judgment or criticism at first, in order to foster the emergence of new and relevant ideas.
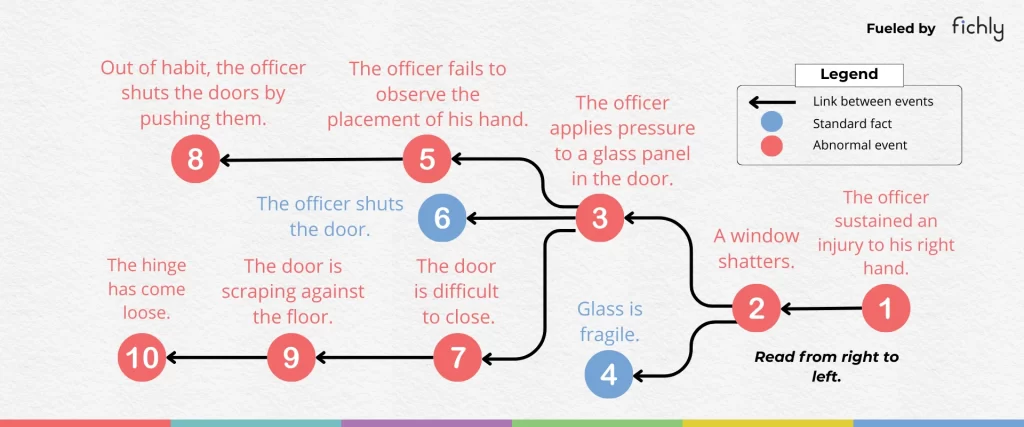
Causal tree diagram, read from right to left, tracing a hand injury back to its causes: a window shattering, pressure applied to a glass panel, a door difficult to close and a loose hinge

Cause tree

The cause tree allows you to analyze an undesirable event by identifying all its real causes, not just the apparent symptoms. By tracing the factual sequence of events, it helps to mobilize teams around a shared understanding of the situation. This tool avoids hasty conclusions and guides you towards sustainable corrective actions based on the real levers for progress.
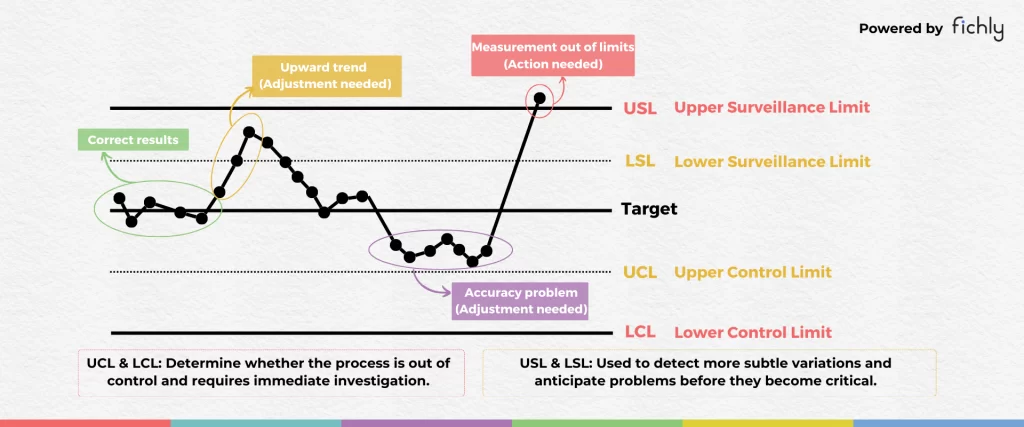
Control chart showing a measurement varying around the target, with warning and control limits, and three situations: accurate results, an upward trend requiring adjustment, and an out-of-limits measurement requiring action

Control Charts

A control chart is a graph used in industry to monitor process parameters in real time. The main objective of control charts is to identify unusual variations and to differentiate normal variations (inherent to the process) from abnormal variations (caused by external factors).
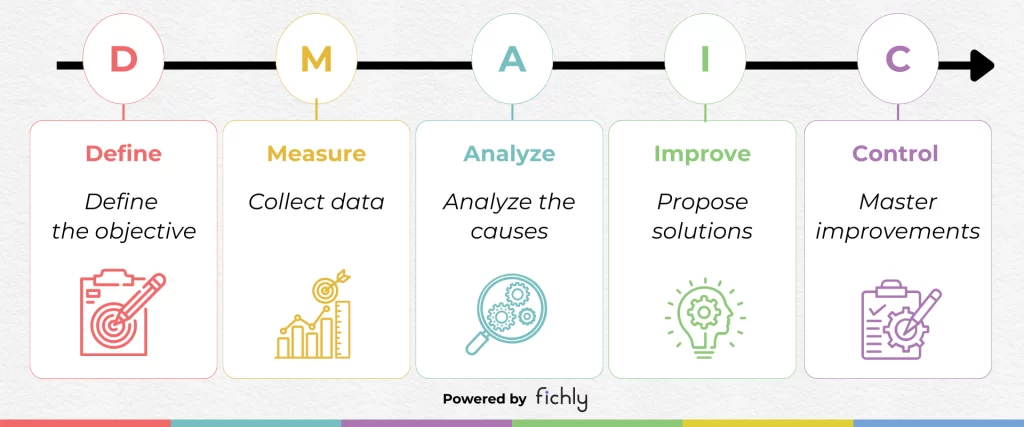
Timeline of the five steps of the DMAIC method: Define the objective, Measure by collecting data, Analyze the causes, Improve by proposing solutions, and Control to master improvements

DMAIC

DMAIC is an acronym for the five phases of a problem-solving and improvement process derived from Lean Six Sigma: Define, Measure, Analyze, Innovate (or Improve), and Control. This is an experimental, analytical, and scientific investigation method carried out in project mode in order to find a lasting solution to a problem and reduce the variability of results.
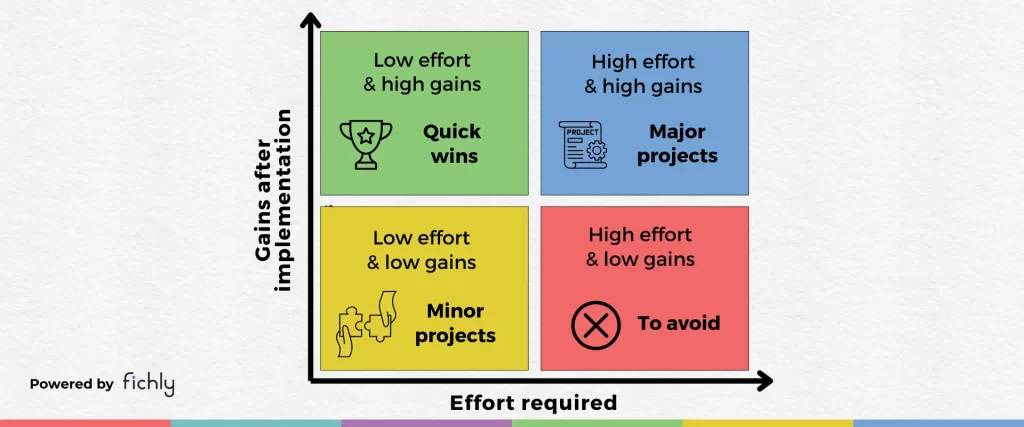
Gain/effort matrix with four quadrants: quick wins (low effort, high gains), major projects (high effort, high gains), minor projects (low effort, low gains) and to avoid (high effort, low gains)

Effort–Impact Matrix

The Effort–Impact Matrix is a tool that helps identify and prioritize actions based on their potential impact and the effort required to carry them out. Potential gains refer to the benefits that can be obtained by completing a given task.
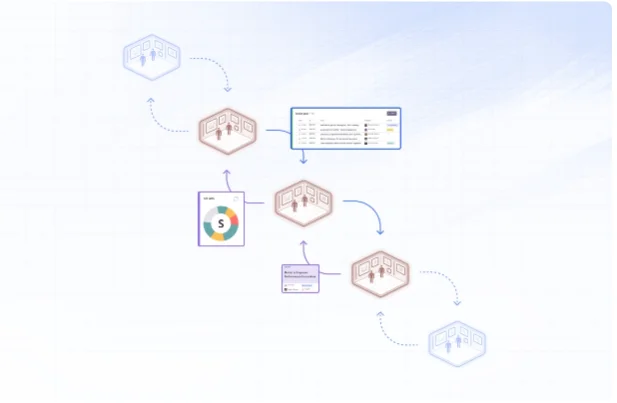
Diagram of an escalation process across several connected Obeya rooms linked by arrows, with an issue card and an SQCDP board moving up from one room to the next

Escalation Process

The Escalation Process is a structured mechanism that allows problems to be quickly escalated when they cannot be resolved at the operational level. In a Lean organization, it often relies on management rituals and visual management to ensure rapid decision-making at the right level. The goal is to deal with obstacles effectively, avoid bottlenecks, and ensure continuity of performance.
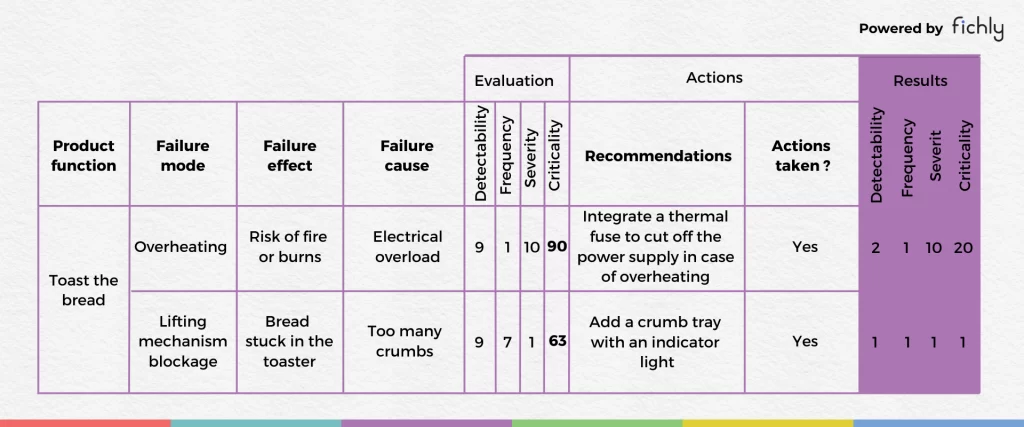
FMEA table applied to a toaster, with two failure modes (overheating, lifting mechanism blockage), their effects and causes, criticality scores before actions and results after corrective actions

FMEA

FMEA (Failure Modes and Effects Analysis) is a reliability analysis method that aims to identify: The failure modes in a product or process. Assess the risks associated with these failures. Rank their importance in terms of severity, probability of occurrence, and detectability. Implement the necessary corrective actions to prevent failures.
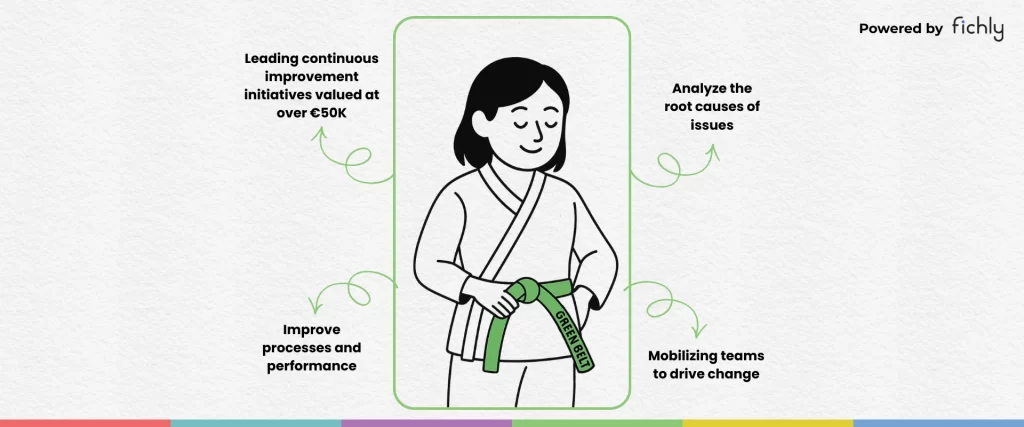
Illustration of a Lean Six Sigma Green Belt in a martial arts uniform with four key responsibilities: leading continuous improvement initiatives valued at over €50K, analyzing root causes, improving processes and performance, and mobilizing teams to drive change

Green Belt

The Green Belt corresponds to an advanced level of mastery of improvement methods. Green Belts manage improvement projects from start to finish using structured approaches such as DMAIC. They analyze complex problems, implement sustainable solutions, and can also supervise or support Yellow Belts in their projects.
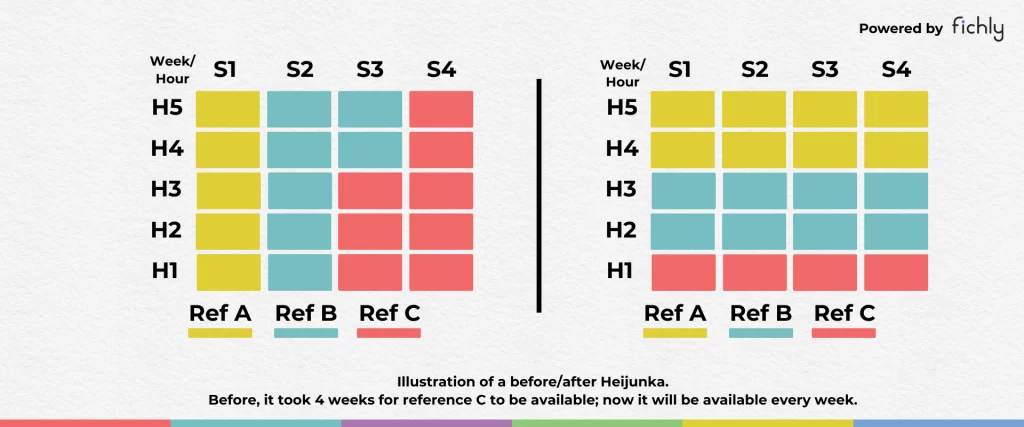
Before/after Heijunka diagram: on the left, products A, B and C are produced in successive blocks over four weeks, so C is only available late; on the right, all three are produced every week

Heijunka

Heijunka (pronounced hey-june-kah) means “to level” in Japanese. It refers to distributing production evenly to avoid peaks and valleys, which reduces overloads and waiting times. Produce a little of everything, all the time. Respond to demand just in time.
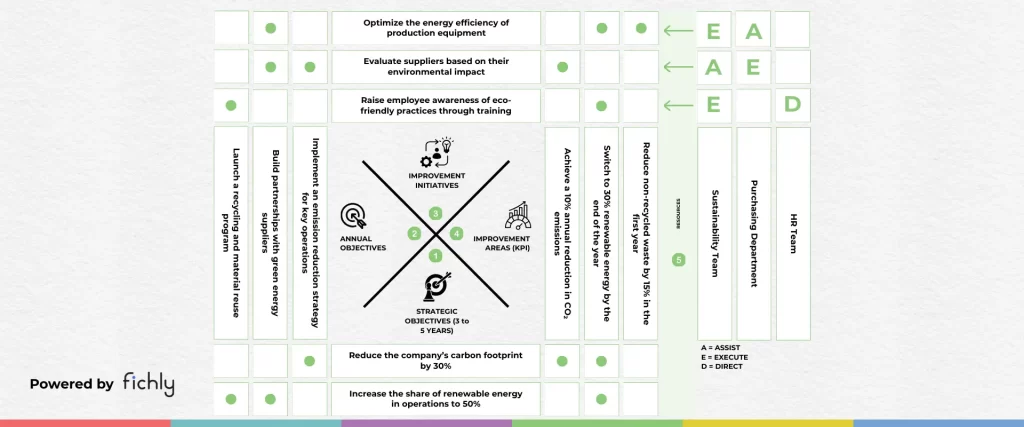
Hoshin Kanri X-matrix on a sustainability strategy, linking strategic objectives, annual objectives, improvement initiatives and improvement areas (KPIs), with resources assigned as Assist, Execute or Direct
Hoshin Kanri

The Hoshin Kanri method refers to a strategy for planning and continuous improvement of a company’s development projects. It is a strategic planning and deployment system that aims to align the company’s objectives from top to bottom, translating the long-term vision into concrete and measurable actions at every level of the organization.
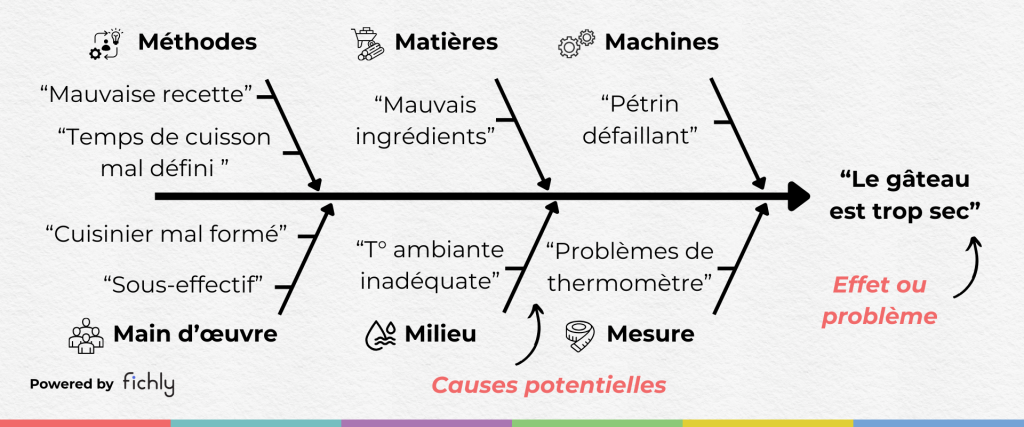
Ishikawa (fishbone) diagram on the problem “the cake is too dry”, with potential causes sorted into six categories: methods, materials, machines, manpower, environment and measurement

Ishikawa

The Ishikawa diagram, also called the cause-and-effect diagram or fishbone diagram, is a problem-solving tool. The effect, the problem encountered, is placed at the head. The causes are represented as branches. These causes, initially the “5 Ms,” have now been extended to the “6 Ms” with the addition of Measurement.
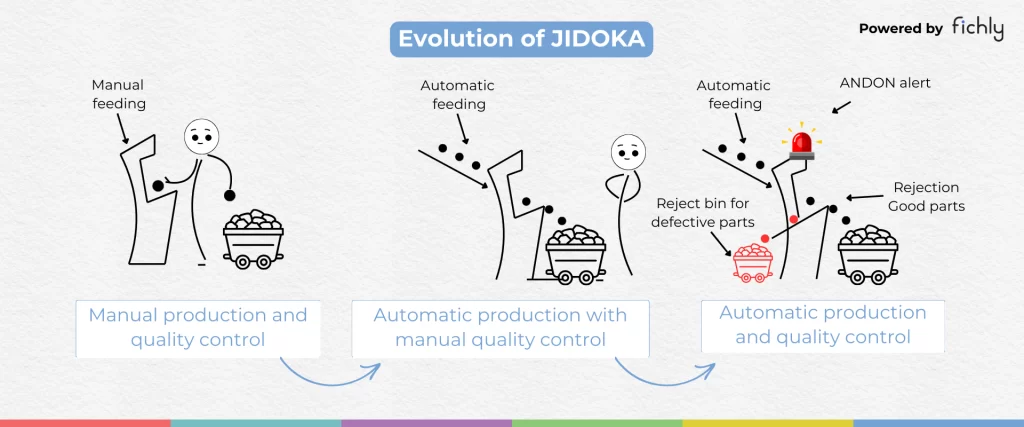
Three-stage illustration of Jidoka: manual production with manual quality control, automatic production with manual quality control, then automatic production and quality control with an Andon alert and a reject bin for defective parts

Jidoka

Jidoka, or “autonomation,” means automation with a human touch. It is one of the two pillars of the Toyota Production System. It is the ability of a machine to detect abnormalities and stop as early as possible to prevent defects. This allows operators to intervene quickly to correct problems.
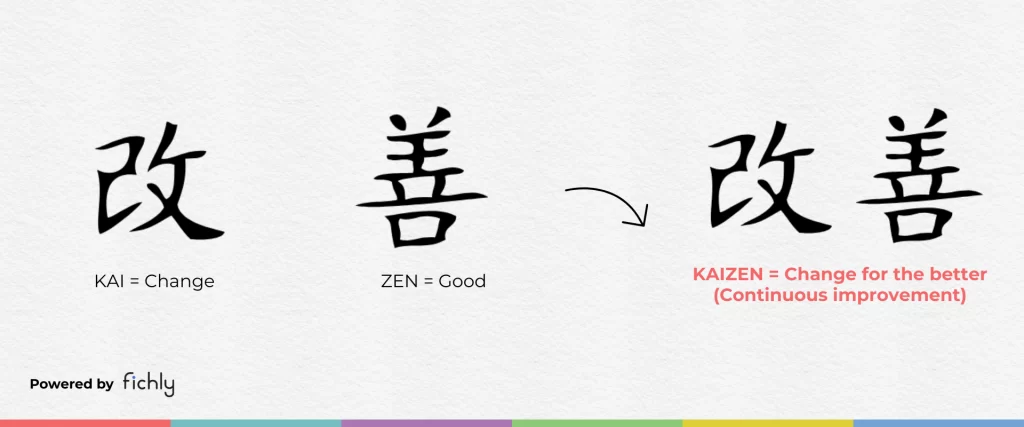
Japanese characters for Kaizen split into kai (改, change) and zen (善, good), combining into kaizen: change for the better, or continuous improvement

Kaizen

The Kaizen project is based on a methodical and time-limited deployment. Thanks to a sustained pace, participants get involved in the process to carry out a structured continuous improvement approach in 3 to 5 days. The action focuses on a limited scope with a specific objective.
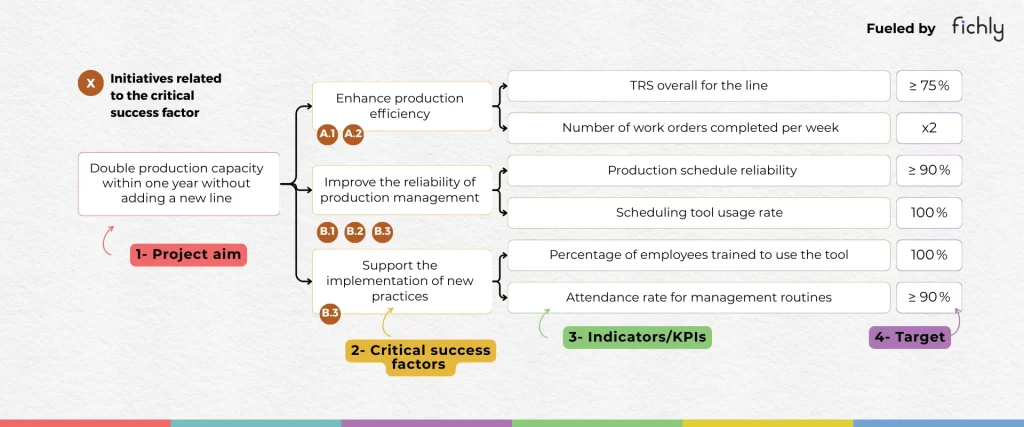
KPI tree starting from the project aim “double production capacity within one year without adding a new line”, broken down into three critical success factors, each with two indicators and a target

KPI Tree

A KPI Tree (performance tree) is a visual tool that links a strategic objective to the operational indicators used to manage it. It breaks down a main objective into several key success factors, then into measurable indicators (KPIs). This tree structure helps teams understand how their actions influence overall performance and facilitates alignment between strategy, improvement projects, and results monitoring.
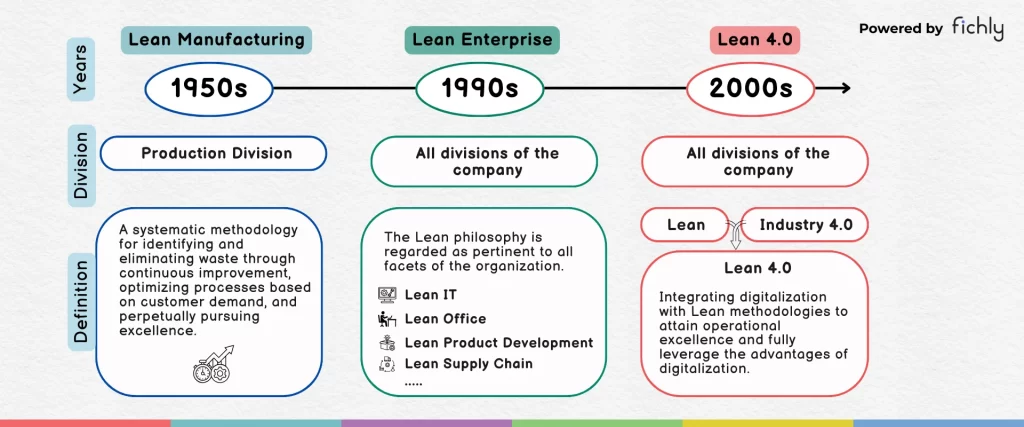
Timeline of Lean’s evolution: Lean Manufacturing in the 1950s for production, Lean Enterprise in the 1990s across all company divisions, and Lean 4.0 in the 2000s combining Lean with Industry 4.0 digitalization

Lean 4.0

Lean 4.0 is the combination of Lean principles and Industry 4.0 technologies. The idea is to combine digitalization with Lean practices to achieve operational excellence and all the benefits of digitalization. The ultimate dream: to produce unique products at mass production costs, significantly increasing flexibility and efficiency. Digitalization will not bring new ideas, but it will multiply the impact of Lean by facilitating the exchange of data and information.

Lean product development

Lean Product Development is an approach that aims to design new products in a more efficient, collaborative, and customer-focused way. It relies on reducing waste, rapid learning, and coordination between teams to accelerate development, secure design choices, and improve value creation.
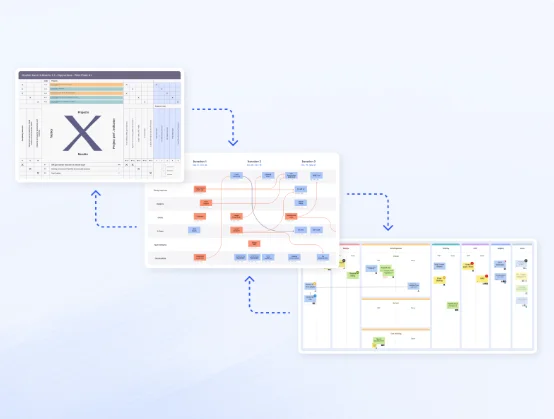
Trois panneaux iObeya connectés par des flèches : une matrice X Hoshin Kanri, un diagramme de dépendances entre initiatives et un tableau d’actions avec post-it, illustrant le déploiement de la stratégie Lean

Lean strategy

Lean strategy involves aligning the company’s strategy with operational execution through clear objectives, measurable indicators, and management rituals. It enables strategic priorities to be rolled out to the front line in order to ensure team alignment, accelerate decision-making, and maximize the impact of improvement actions.
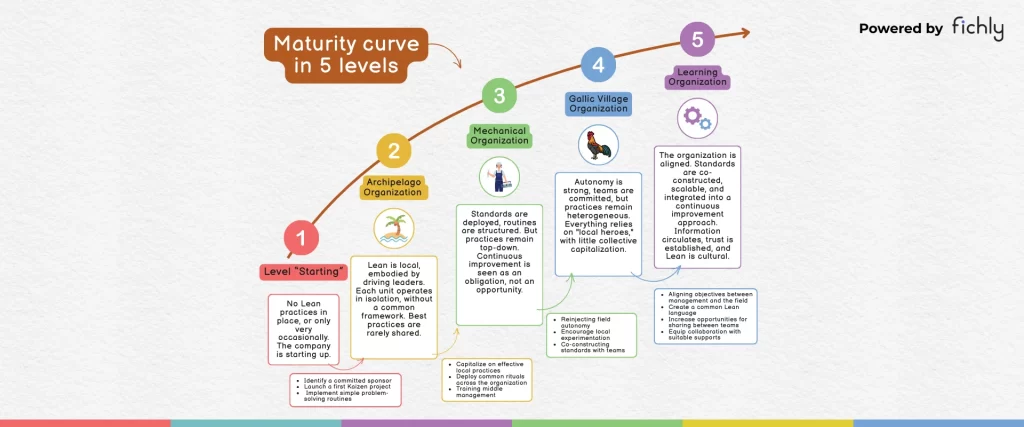
Rising curve of Lean maturity in five levels: starting, archipelago organization, mechanical organization, Gallic village organization, and learning organization, each with a description and recommended actions to reach the next level

Learning organization

A Lean learning organization is a company that continuously develops the skills of its teams in order to improve its processes and performance. It encourages experimentation, the right to make mistakes, and collective learning based on problems encountered in the field. Through practices such as PDCA, knowledge sharing, and personal development, the organization learns continuously and progresses in a sustainable manner.
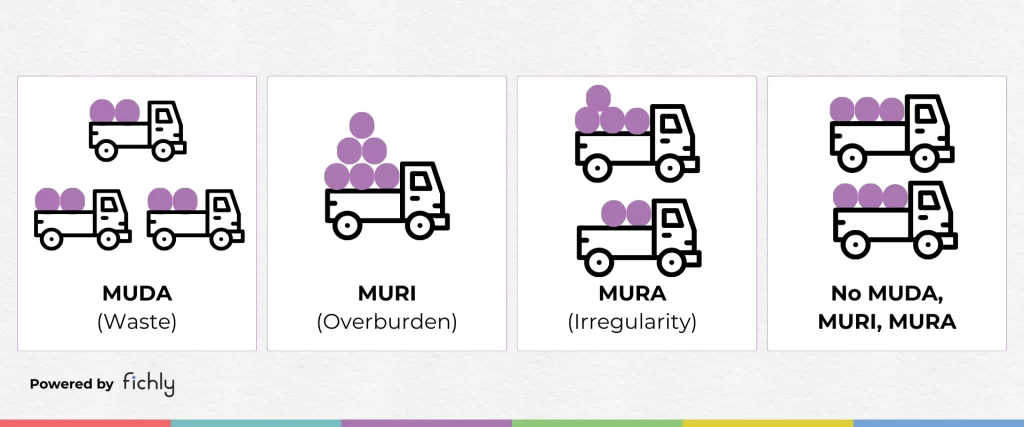
Four illustrations with trucks carrying loads: Muda (waste) with three half-empty trucks, Muri (overburden) with one overloaded truck, Mura (irregularity) with unevenly loaded trucks, and an ideal case with two evenly loaded trucks

Muda Muri Mura

The 3M method (Muda, Mura, Muri) corresponds to the 3 types of waste in production and work environments. Muda (waste): any activity in a process that does not add value Muri (overburden): any activity involving unreasonable strain on staff, materials, or equipment Mura (unevenness): any variation leading to unbalanced situations
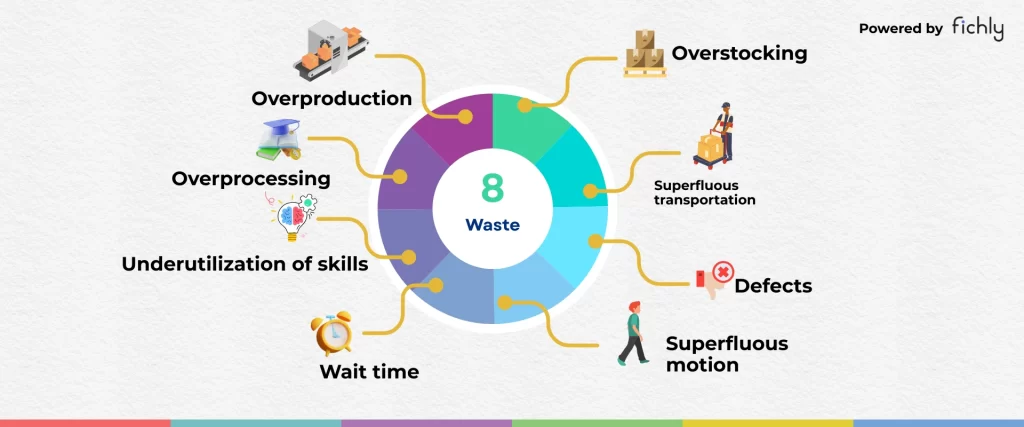
Circular diagram of the 8 wastes of Lean: overproduction, overstocking, superfluous transportation, defects, superfluous motion, wait time, underutilization of skills and overprocessing

Mudas

In Lean Management, muda refers to waste, i.e., all activities that consume resources (time, energy, materials, money) without creating value for the customer. The concept of muda was formalized by Taiichi Ohno in the Toyota Production System. The goal of Lean is to identify and eliminate this waste in order to improve process performance and focus efforts on value-added activities.
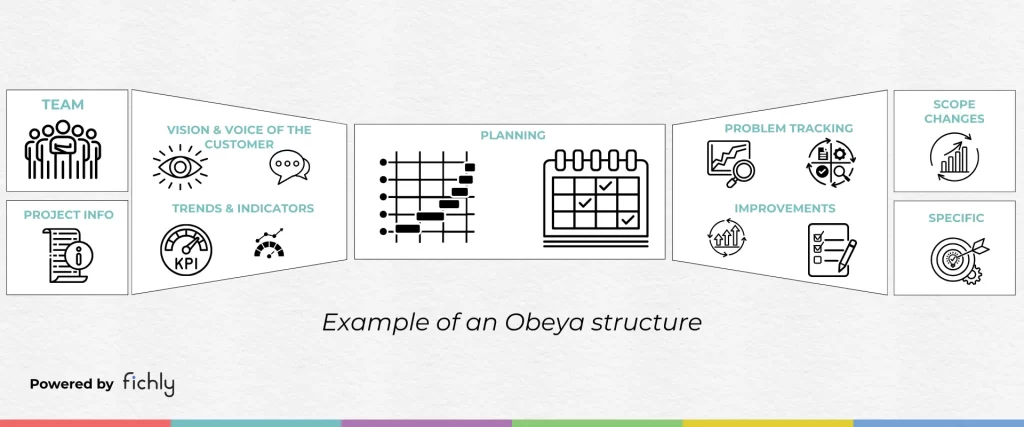
Example of an Obeya room layout with nine areas: team, project info, vision and voice of the customer, trends and indicators, planning, problem tracking, improvements, scope changes and specific topics

Obeya

Obeya, which means “big room” in Japanese, is a project management tool that involves using a large physical or virtual room where key project information is displayed and shared visually. This tool is used to improve communication between teams, facilitate quick decision-making, and coordinate efforts on complex projects.
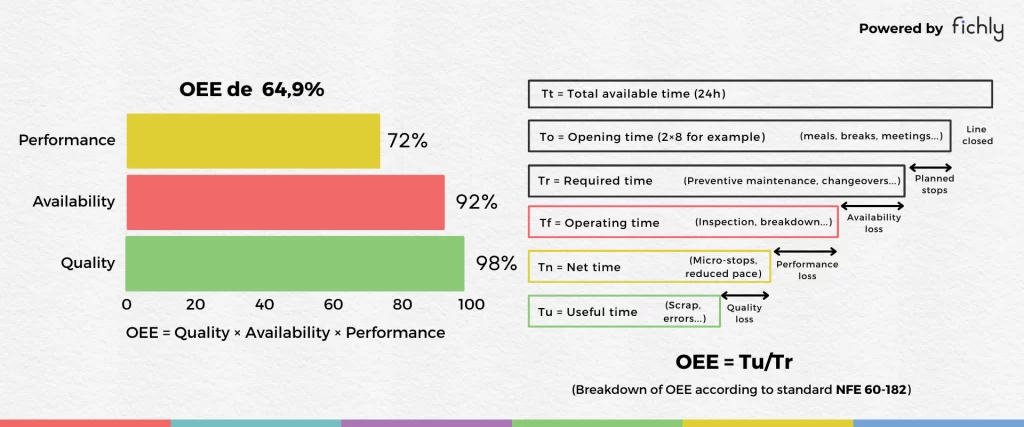
OEE of 64.9% broken down into performance (72%), availability (92%) and quality (98%), next to a time-loss diagram from total available time to useful time, following standard NF E 60-182

OEE

OEE (Overall Equipment Effectiveness) is a performance measure (KPI) that evaluates the overall efficiency of production equipment. It combines three elements: the availability of resources (machines, operators, etc.), operational performance, and the quality of manufactured products. It reflects the actual capacity of the equipment to produce defect-free units within a given time compared to its theoretical capacity.
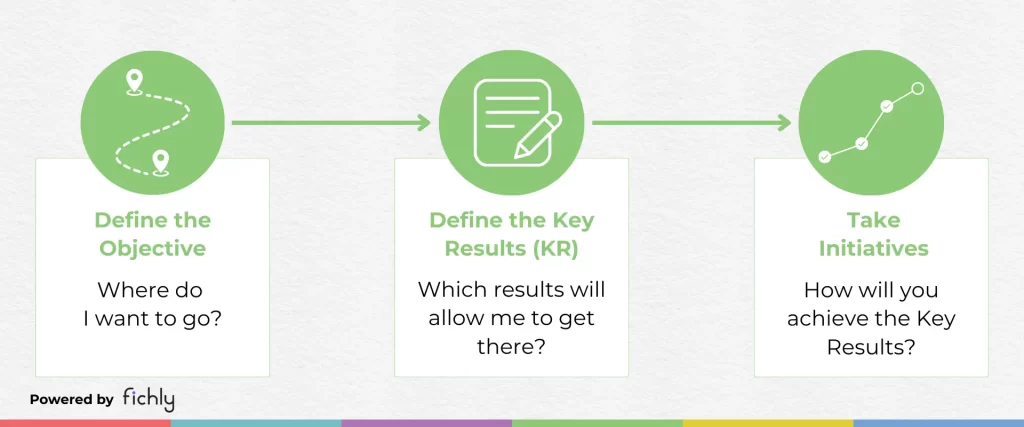
Three-step OKR diagram: define the objective (where do I want to go?), define the key results (which results will get me there?), and take initiatives (how will you achieve the key results?)

OKR

OOKR (Objectives and Key Results) is a method for defining and tracking ambitious goals. Have an inspiring Objective (O), and to know whether it has been achieved, use measurable Key Results (KR). Objectives should not be technical and should not contain metrics. This method helps align individual and team efforts with the company’s strategic objectives, fostering transparency and engagement. OKRs can be applied at all levels of the organization and allow teams to maintain autonomy in achieving their objectives.
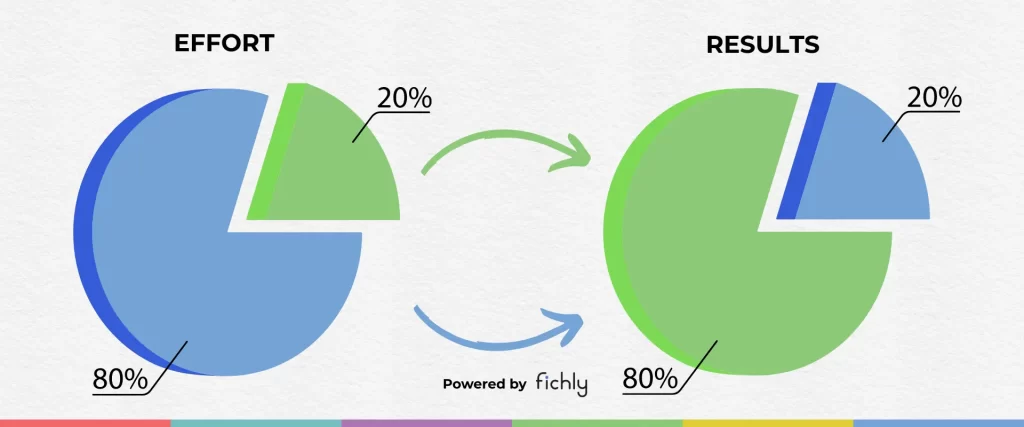
Two pie charts illustrating the Pareto principle: 20% of the effort (green slice) generates 80% of the results, while the remaining 80% of the effort (blue) generates only 20% of the results, shown with crossing arrows

Pareto (80/20)

Pareto analysis, also known as the 80/20 principle, is a statistical technique that helps identify the most important problems to solve in order to have the greatest impact. Based on the Pareto principle, this analysis shows that, generally, 20% of the efforts generate 80% of the results.
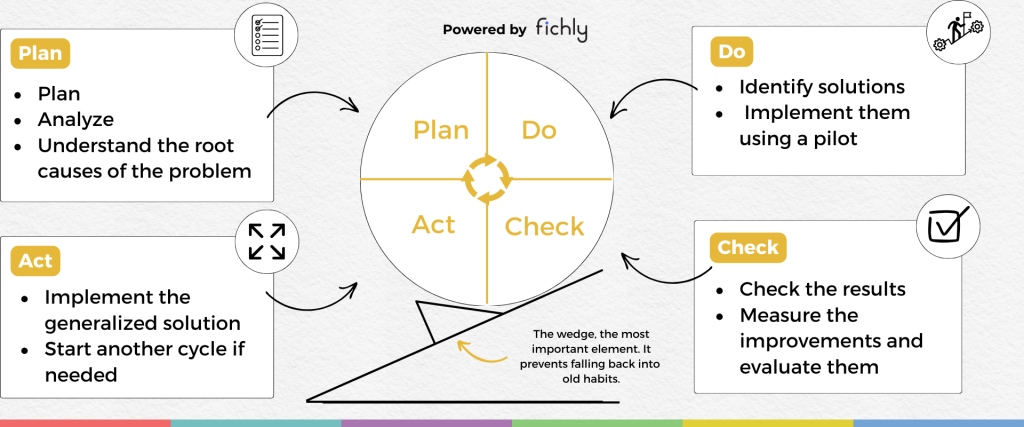
PDCA cycle shown as a wheel divided into four quadrants (Plan, Do, Check, Act) rolling up a slope, with a wedge preventing it from rolling back, and a list of key actions for each step

PDCA

The PDCA (Plan-Do-Check-Act) is a continuous improvement method with 4 steps: Plan an action, Do (implement) this action, Check the results, and Act (sustain) the results in a lasting way. Simple and cyclical, it makes it possible to test, learn, and continuously improve products and processes.
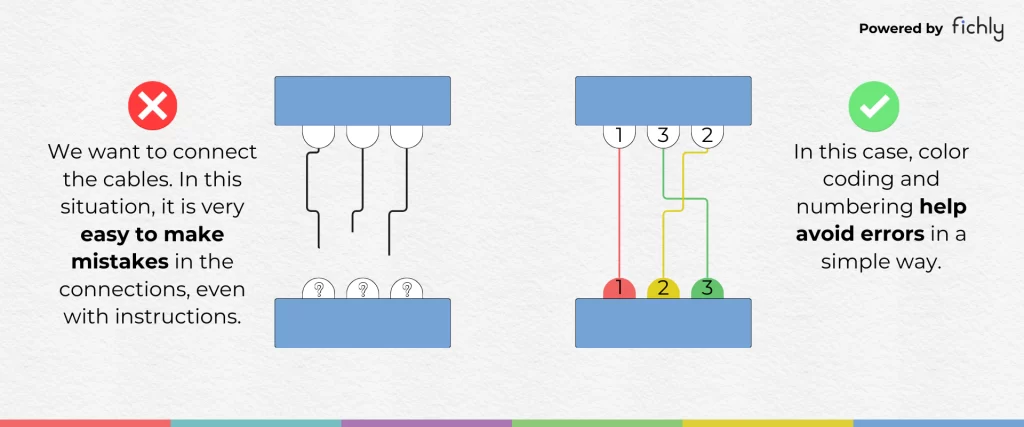
Before/after Poka-yoke illustration: on the left, three unmarked cables that are easy to connect wrongly; on the right, the same connections made error-proof with color coding and numbering (1, 2, 3)

Poka-yoke

A defect prevention method that uses simple devices/poka-yoke mechanisms to avoid production errors. The objective is to make it impossible to commit an error or to make it immediately detectable. The approach relies on two types of devices: prevention devices and detection devices.
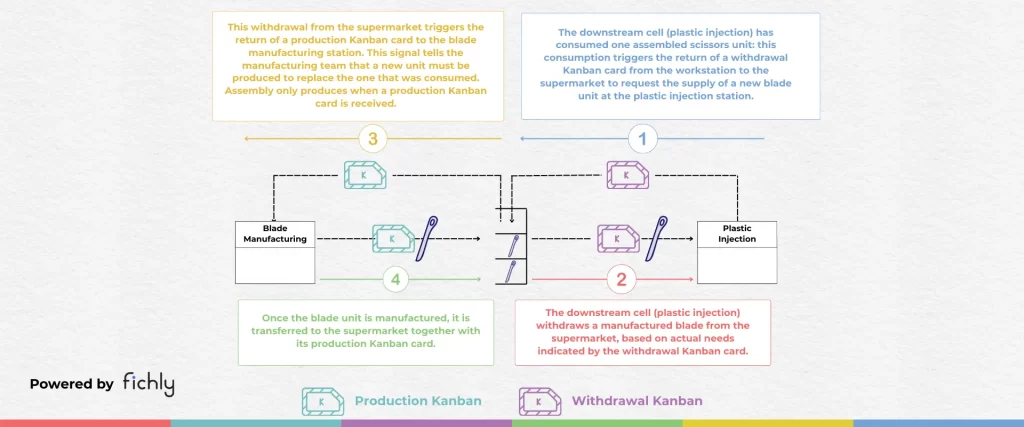
Four-step Kanban pull flow between blade manufacturing and plastic injection with a supermarket in between: consumption triggers a withdrawal Kanban, the withdrawal triggers a production Kanban, and the manufactured blade is sent back to the supermarket

Pull flow

The “Pull System” is a process triggered by actual customer demand rather than by forecasts, which helps reduce inventory. In a push flow, products are manufactured in advance and then pushed to the next steps, whether they are immediately needed or not. A pull flow operates according to actual demand. Production only takes place when there is an order or a specific need. Products are pulled by customer orders or actual consumption.
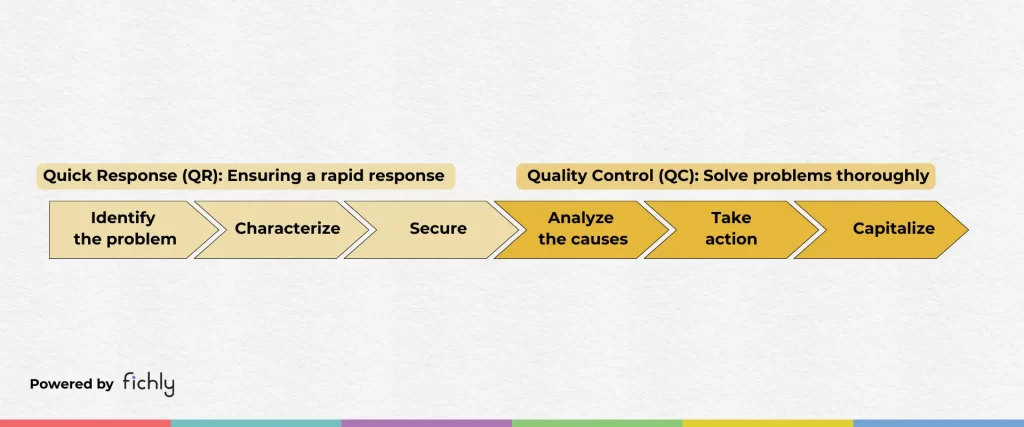
QRQC process in six steps in two phases: Quick Response (identify the problem, characterize, secure) and Quality Control (analyze the causes, take action, capitalize)

QRQC

Problem-solving system that emphasizes rapid response to problems as soon as they arise. The more critical the problem, the higher up the hierarchy it is escalated. Quick Response: identify the problem, characterize it, and implement security measures. Quality Control: structured and logical reasoning to find a sustainable solution.
Shop floor management illustration with two workers at a production line, surrounded by three principles: apply the 3G approach (Gemba, Genbutsu, Genjitsu), establish a clear communication cascade, and use visual management tools such as SQCDP boards, Kanban boards and the PDCA cycle

Shopfloor Management system

Shopfloor Management is a management method specific to production workshops and factories. It enables workshops to have a clear, safe, stable, and goal-oriented work process thanks to visual management. According to Kiyoshi Suzaki, author of “The New Shop Floor Management,” this method encompasses all factory-related activities: inventory management, equipment management, operations management, manufacturing management, and product processing management. In this article, we will look at the pillars of the Shop Floor Management System approach and its essential components, before concluding with the keys to successful implementation.
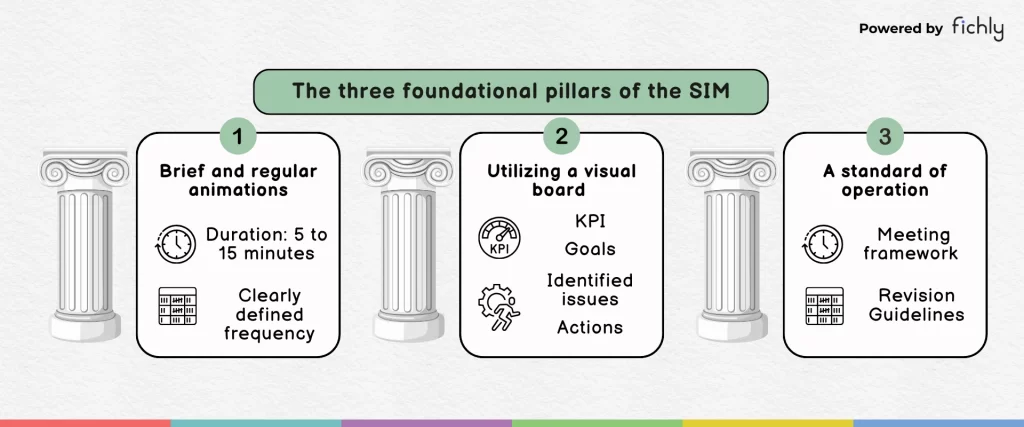
Three Greek columns representing the pillars of SIM: brief and regular huddles (5 to 15 minutes at a defined frequency), a visual board (KPIs, goals, identified issues, actions) and a standard of operation (meeting framework, revision guidelines)

Short Interval Management (SIM)

An AIC is a ritualized system that allows you to regularly report various problems, measure performance, and, above all, work on significant discrepancies in order to find their causes.
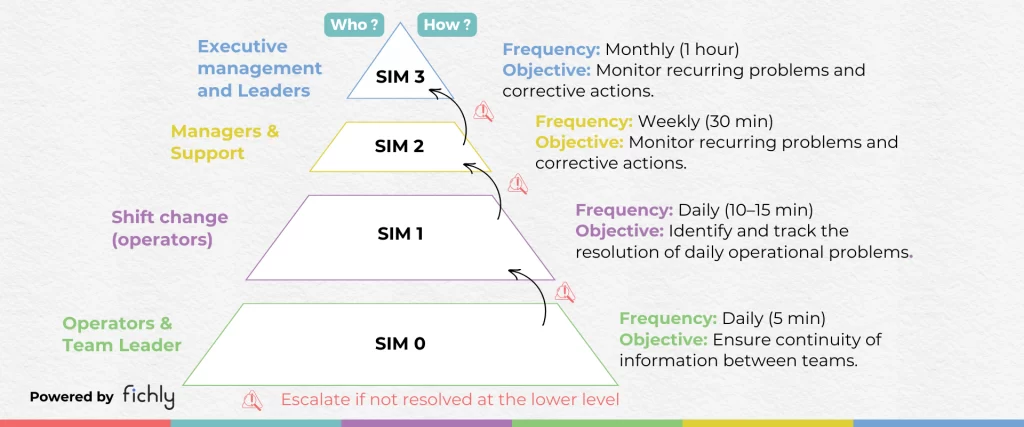
Pyramid of four short interval management levels with escalation arrows: SIM 0 (operators and team leader, daily, 5 min), SIM 1 (shift change, daily, 10 to 15 min), SIM 2 (managers and support, weekly, 30 min) and SIM 3 (executive management, monthly, 1 hour)

SIM

Short Interval Management (SIM) is a communication system that consists of holding regular and frequent meetings to monitor and adjust production in real time. These short meetings make it possible to discuss immediate problems, track performance indicators (such as OEE or defects), and quickly make decisions to address deviations from objectives.
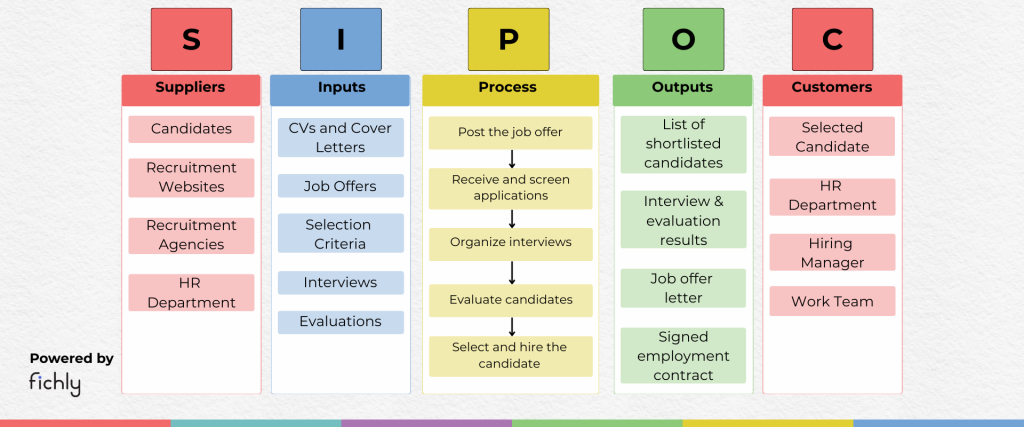
SIPOC diagram of a recruitment process in five columns: suppliers (candidates, recruitment websites and agencies, HR), inputs (CVs, job offers, criteria), a five-step process from posting the offer to hiring, outputs (shortlist, evaluations, offer letter, contract) and customers (selected candidate, HR, hiring manager, work team)

SIPOC

Its purpose is to provide an overview of the essential elements of a process so that everyone understands how it works, what it needs, and what it produces. Suppliers: the source of inputs Input: the resources needed for the process to operate Process: the general steps of the process Output: the results of the process Customers: the people who receive the outputs/results or benefit from the process
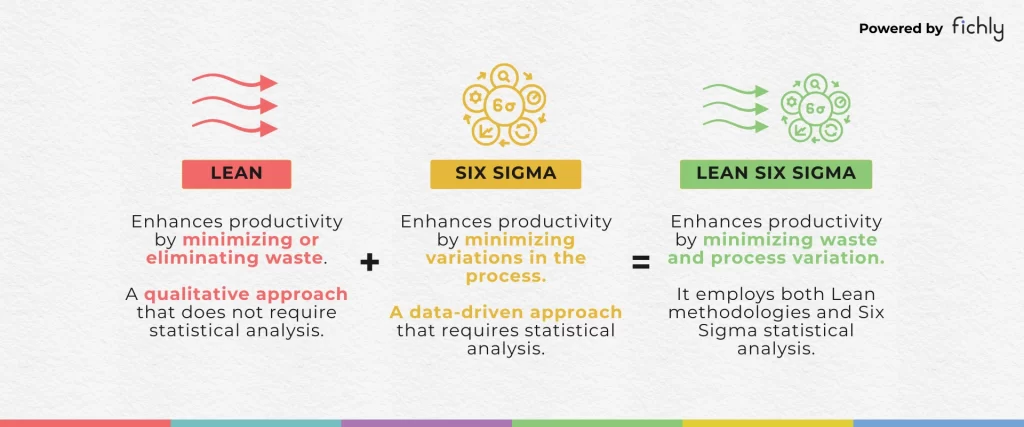
Equation showing Lean (minimizing waste, qualitative approach) plus Six Sigma (minimizing process variation, data-driven approach) equals Lean Six Sigma, which combines both methods and statistical analysis

Six Sigma

Six Sigma is a process improvement method aimed at reducing variability and defects in order to improve quality and operational performance. Developed in the 1980s at Motorola, then widely disseminated by companies such as General Electric, this approach is based on data analysis and a structured problem-solving process. The goal of Six Sigma is to achieve a very high level of performance, corresponding to less than 3.4 defects per million opportunities in a process. Today, Six Sigma is often combined with the principles of Lean Management to form the Lean Six Sigma approach, which aims to simultaneously improve quality, process performance, and value creation for the customer.
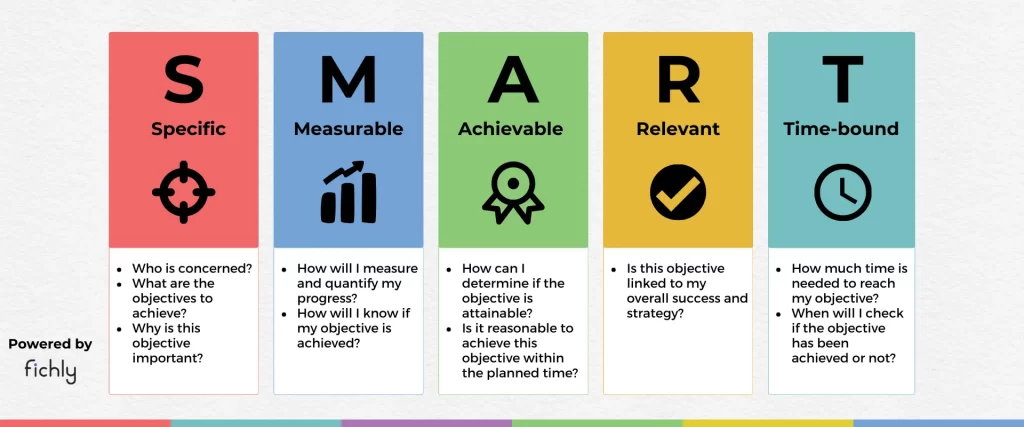
The five SMART criteria for setting objectives, in five colored columns: Specific, Measurable, Achievable, Relevant and Time-bound, each with an icon and the key questions to ask

SMART

SMART is a method used to clearly define objectives. The acronym SMART stands for Specific, Measurable, Achievable, Relevant, and Time-bound. This approach makes it possible to set precise and structured objectives, which facilitates their monitoring and achievement.
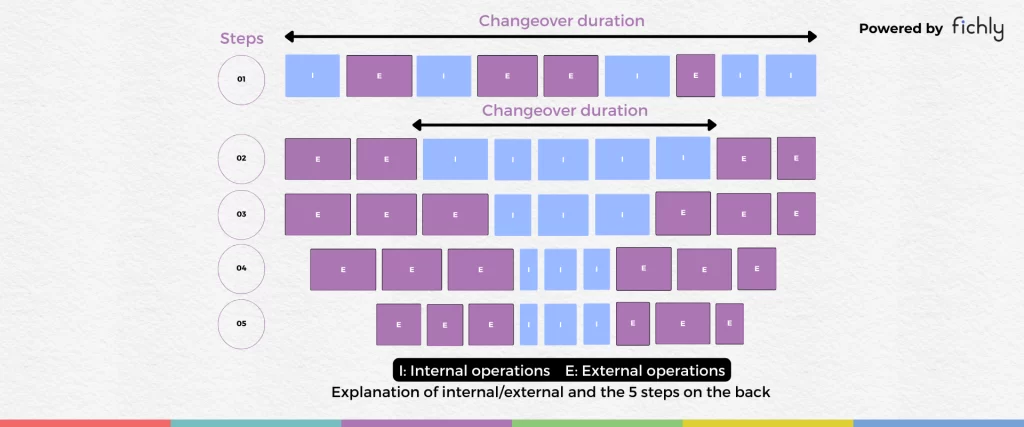
SMED diagram in five steps showing a changeover made of internal (I) and external (E) operations: as external operations are moved outside the stoppage, the changeover duration shrinks from step 1 to step 5

SMED

When a machine is stopped and reconfigured to manufacture another model, it is not producing. SMED (Single-Minute Exchange of Die) is the tool used to reduce the changeover time between one model and another. In French, it is often translated as “tool change in less than 10 minutes.”
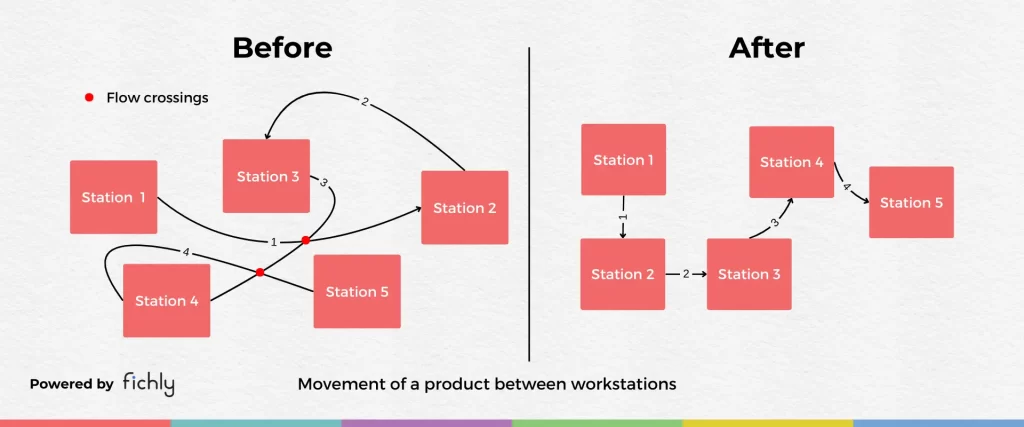
Before/after spaghetti diagram of a product moving between five workstations: before, the flows cross and loop back, with two crossing points; after, the stations are rearranged so the product moves in a simple sequence from station 1 to 5

Spaghetti diagram

The spaghetti diagram is a visualization tool used to represent and analyze the physical flows of people within a given space. Its main purpose is to identify inefficiencies, waste, and opportunities for optimization by highlighting excessive or redundant movements.
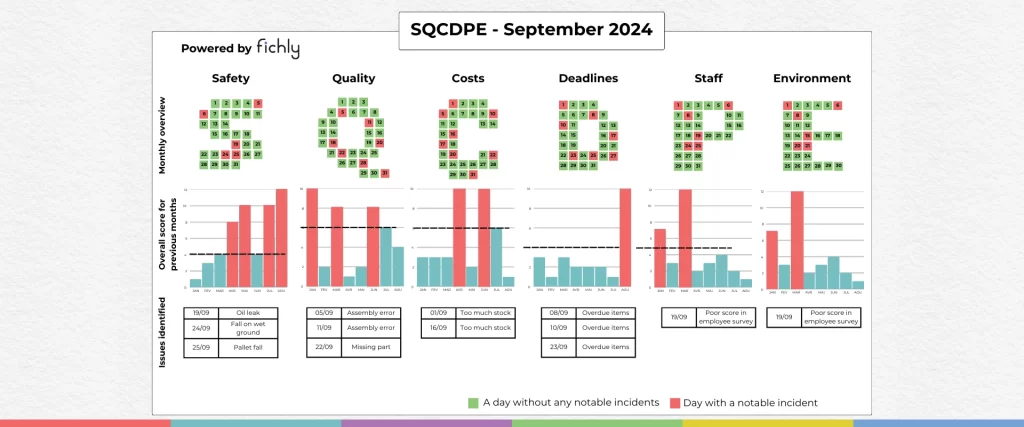
SQCDPE board for September with six columns (Safety, Quality, Costs, Deadlines, Staff, Environment), each showing a monthly calendar of days with or without incidents, a bar chart of monthly scores against a target line, and a list of identified issues

SQCDPE

Safety, quality, costs, deadlines, personnel: these are the words behind the acronym SQCDPE. It is a visual management method for monitoring and improving the key performance indicators of a production process over the course of an entire month. It is a collaborative dashboard that ensures sustainability and a high level of performance.
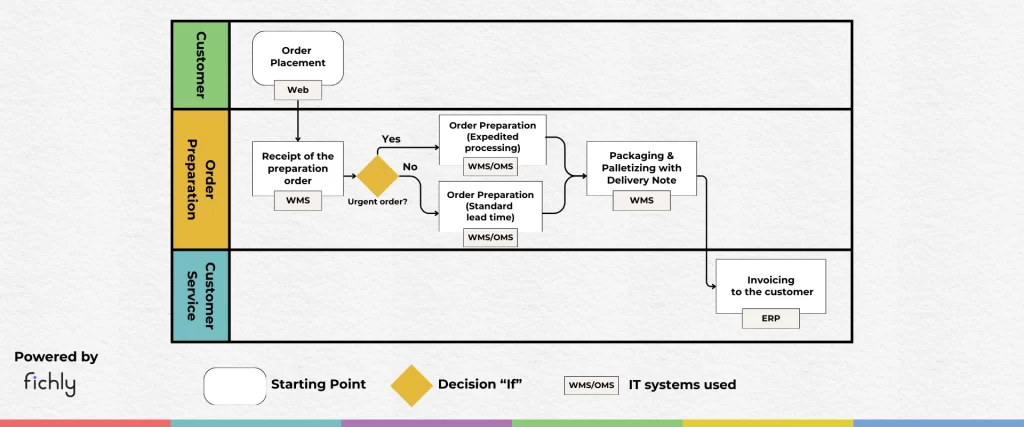
Swimlane diagram of an order process in three lanes (customer, order preparation, customer service): order placement on the web, a decision on urgent orders leading to expedited or standard preparation, then packaging and palletizing, and invoicing, with the IT system used at each step

Swimlane

A swimlane diagram is a type of flowchart that divides responsibilities into different visual categories (the “swimlanes”). Each lane represents a person, a team, or a department, making it easier to understand roles and interactions within a process.
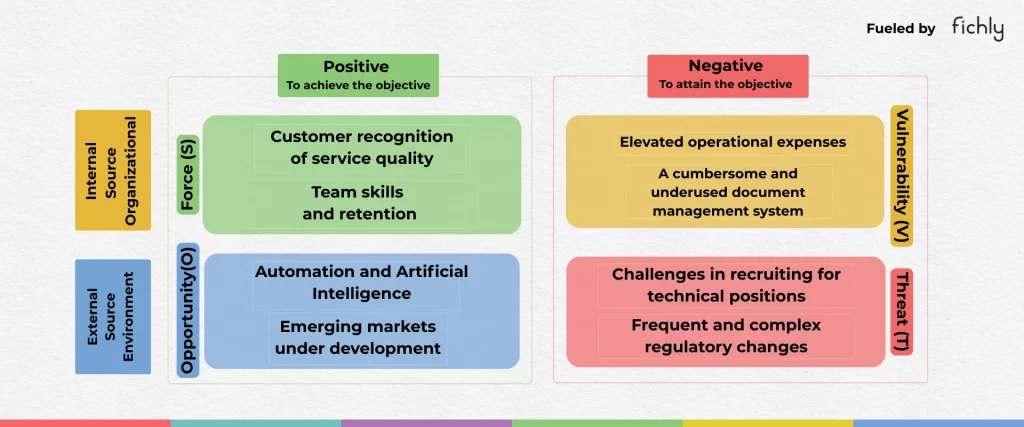
SWOT matrix with four quadrants: strengths (customer recognition of service quality, team skills and retention), weaknesses (elevated operational expenses, a cumbersome document management system), opportunities (automation and AI, emerging markets) and threats (recruiting challenges, regulatory changes)

SWOT

SWOT analysis is a tool that allows you to make a simple diagnosis of an activity or project by comparing its strengths, weaknesses, opportunities in the context, and external threats. In QSE, this matrix helps you take a step back, identify areas for improvement, and anticipate risks that could impact performance.
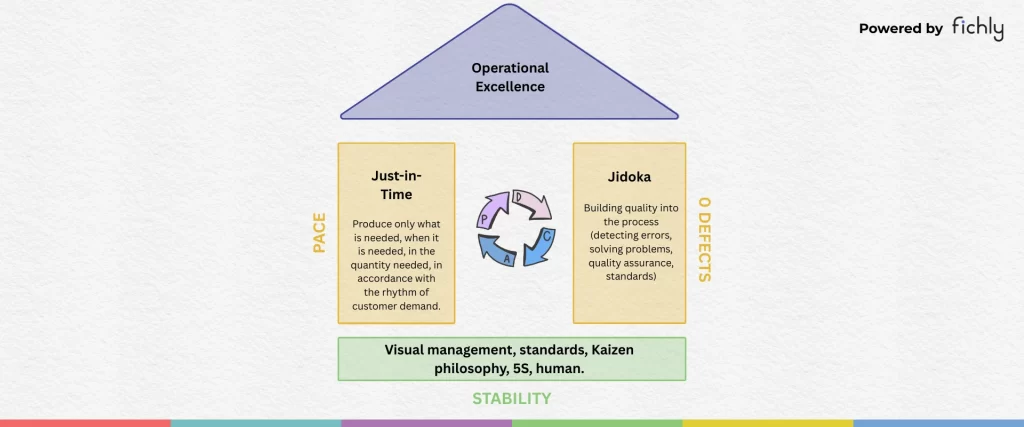
House diagram of the Toyota Production System: operational excellence as the roof, Just-in-Time (pace) and Jidoka (zero defects) as the two pillars around a PDCA cycle, and a foundation of visual management, standards, Kaizen, 5S and human involvement for stability

T.P.S. Toyota Production System

The Toyota Production System is a system developed by Japanese automaker Toyota that encompasses its management philosophy and practices. TPS organizes the manufacturer’s manufacturing and logistics, including interaction with suppliers and customers. The system is one of the major precursors of the more generic Lean system. Taiichi Ohno and Eiji Toyoda, Japanese engineers, developed the system between 1948 and 1975.
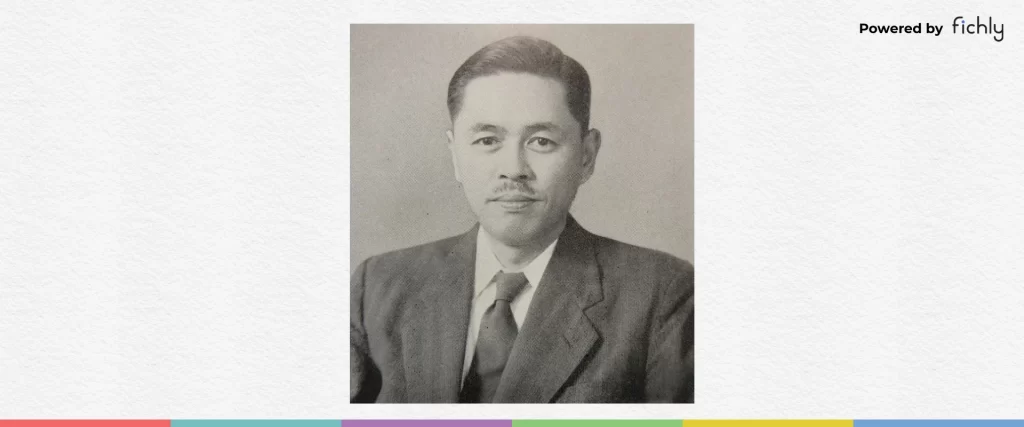
Black-and-white portrait of Taiichi Ohno, in a suit and tie

Taiichi Ōno

Taiichi Ohno (1912–1990) was a Japanese industrial engineer considered one of the main architects of the Toyota Production System (TPS), the production system that inspired Lean Management. At Toyota, he developed a new way of organizing work aimed at producing more efficiently by eliminating waste and continuously improving processes. His work led to the formalization of fundamental concepts such as Just-in-Time, pull flow, inventory reduction, and the identification of muda (waste).
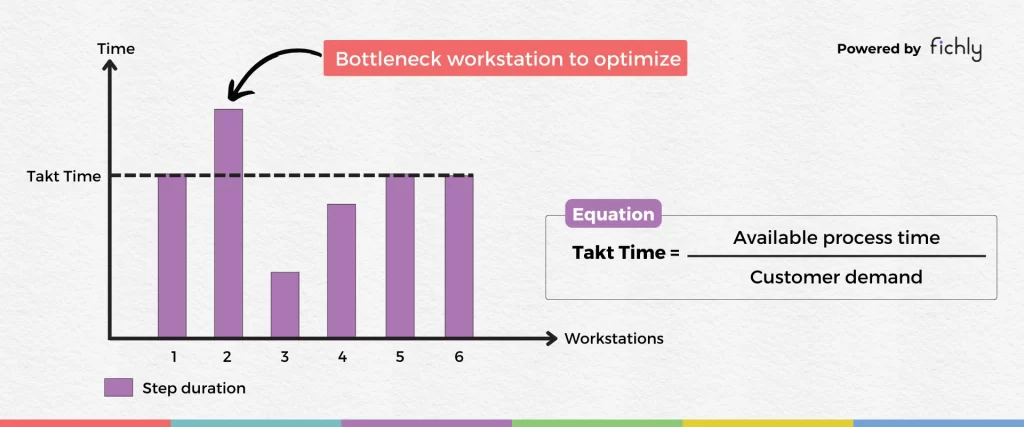
Bar chart of step durations across six workstations compared with the takt time line, where workstation 2 exceeds it and is flagged as the bottleneck to optimize, next to the formula: takt time equals available process time divided by customer demand

Takt Time

TAKT is the German word for “beat.” Takt Time is the pace at which a product must be manufactured to meet customer demand. It is used to balance the production line in order to minimize inventory and adapt capacity to demand.
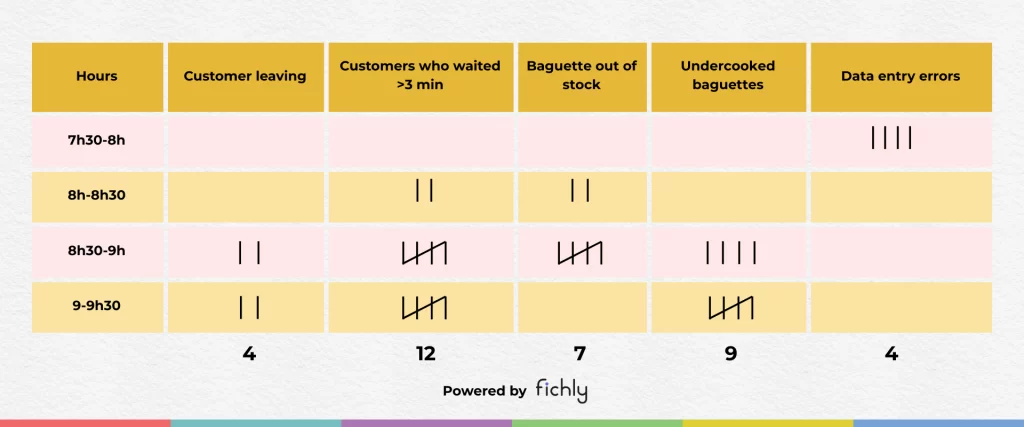
Tally sheet for a bakery from 7:30 to 9:30 with five incident types (customers leaving, customers waiting over 3 minutes, baguettes out of stock, undercooked baguettes, data entry errors), with totals of 4, 12, 7, 9 and 4, and incidents peaking between 8:30 and 9:30

Tallying

Tally marking is a simple and visual observation method that consists of counting a phenomenon each time it occurs by drawing a mark (or tally). The goal is not to obtain precise statistics, but to make the recorded volumes visible: how many customers are waiting, how many products are missing, how many reworks are performed. This approach turns perceptions into concrete facts and highlights the key friction points of a process, without the need for complex tools.
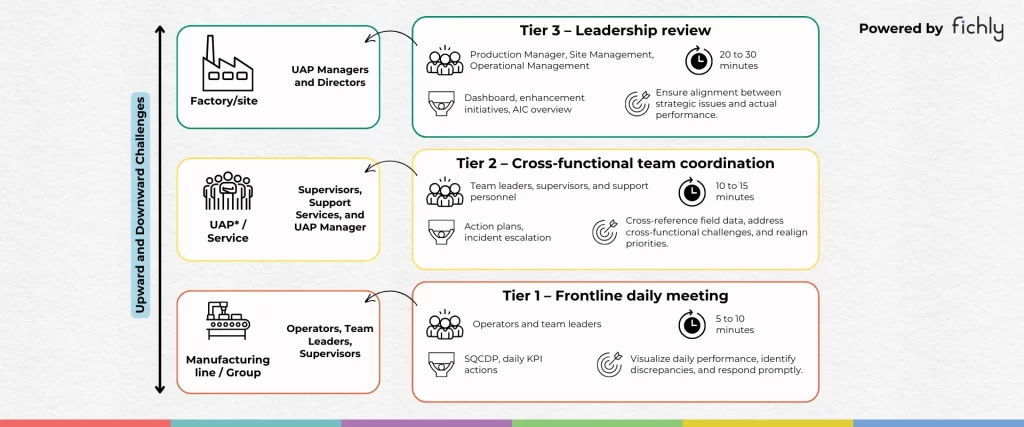
Three-tier daily management structure: Tier 1 frontline daily meeting (operators and team leaders, 5 to 10 minutes), Tier 2 cross-functional team coordination (10 to 15 minutes) and Tier 3 leadership review (20 to 30 minutes), with participants, content and purpose for each, linked by an upward and downward arrow

TOP 5 / 15 / 30

The TOP 5/15/30 is a system of daily management rituals synchronized at different levels of the organization. Each hierarchical level (team, department, management) holds a performance review meeting to share indicators, identify discrepancies, and decide on actions to be taken. This system ensures that problems are reported quickly, improves coordination between teams, and aligns operational performance with strategic objectives. TOP 5 A short ritual at the team level to monitor daily performance, identify discrepancies, and initiate initial actions. TOP 15 Department-level coordination meeting to analyze issues reported from the field, adjust priorities, and monitor action plans. TOP 30 Site- or management-level steering meeting to align operational performance with strategic objectives and arbitrate key decisions.
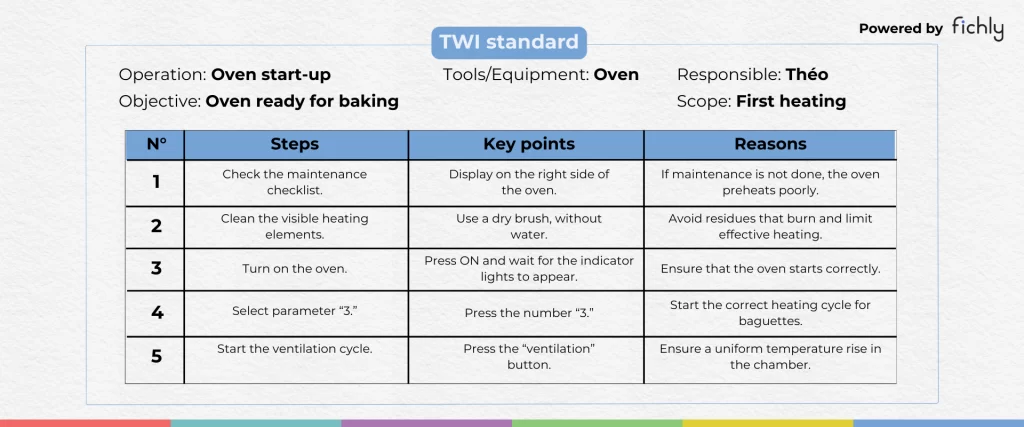
TWI standard for oven start-up in a bakery, with operation, objective, tools, responsible person and scope, followed by a five-step table listing the steps, key points and reasons, from checking the maintenance checklist to starting the ventilation cycle

TWI

TWI (Training Within Industry) is a standardization and training method that makes it possible to transfer know-how in a clear and factual way. It is based on the idea that each task can be broken down into: The major steps: what needs to be done, The key points: how to do it correctly, The reasons: why it is important, giving meaning and aiding retention.
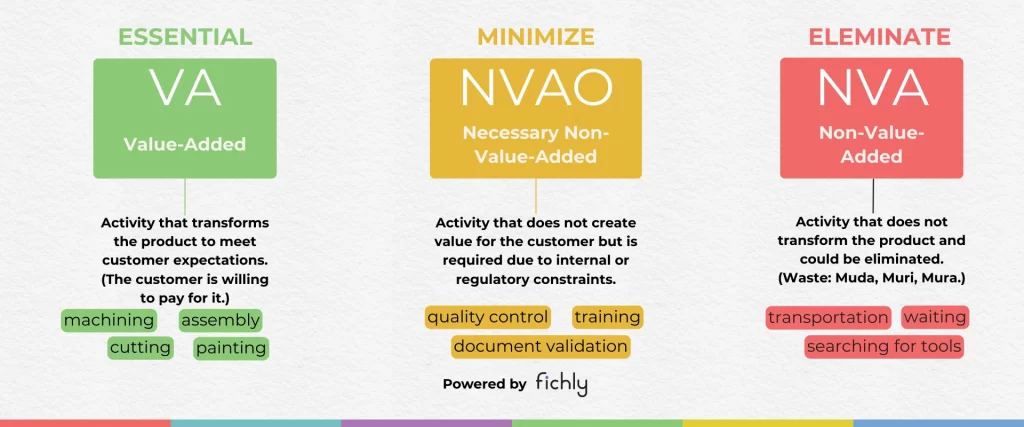
Three categories of activities in Lean: value-added (VA, essential: machining, assembly, cutting, painting), necessary non-value-added (NVAO, to minimize: quality control, training, document validation) and non-value-added (NVA, to eliminate: transportation, waiting, searching for tools)

VA, NVA, NVAO

This classification makes it possible to distinguish activities according to their contribution to customer value: VA – Value-Added: transforms the product or service to meet a customer expectation and justifies payment. NVAO – Non-Value-Added but Obligatory: does not create value but is essential for legal or organizational reasons. NVA – Non-Value-Added: does not transform the product or service and can be eliminated without impacting the customer.
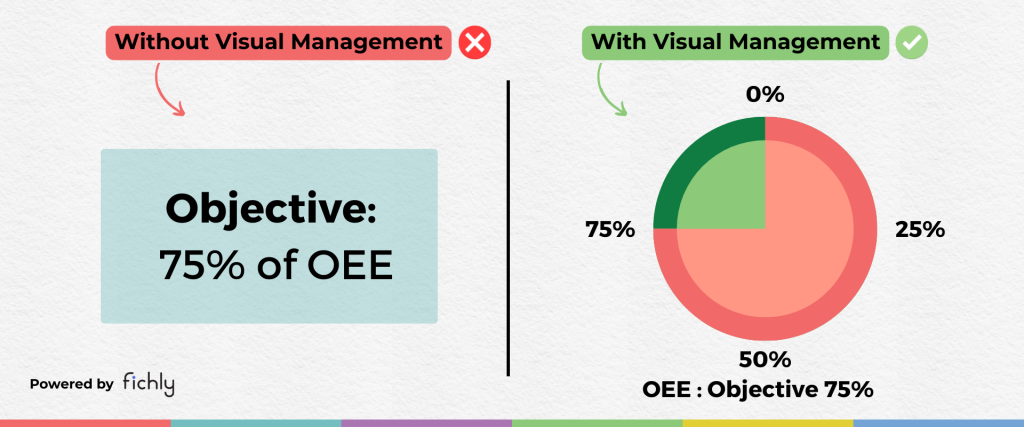
Before/after comparison of visual management: on the left, a plain text “Objective: 75% of OEE”; on the right, a circular gauge with a 0 to 75% scale showing progress toward the 75% OEE objective in green and red

Visual Management

Visual Management is a management technique that uses visual representations to communicate important information clearly, quickly, and effectively. Its goal is to organize so that everyone can see and understand the activity in their work environment and enable everyone to take action to improve it.
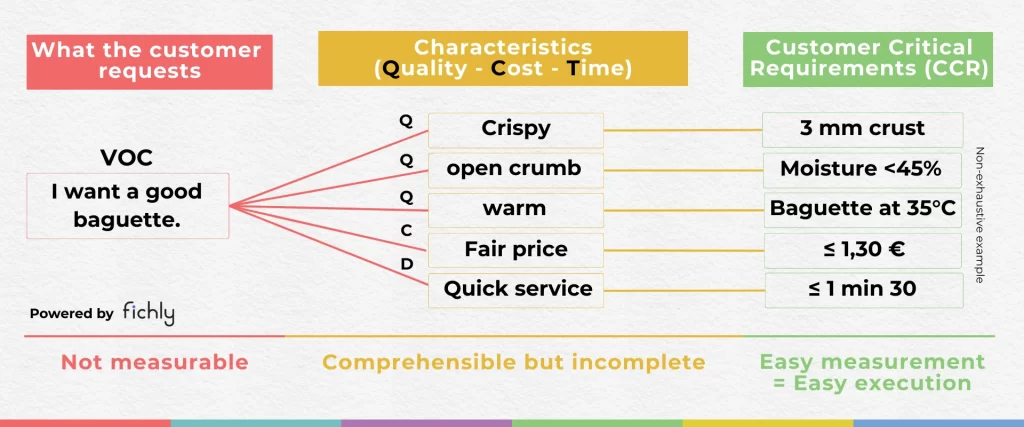
Diagram translating the customer request “I want a good baguette” into five characteristics (crispy, open crumb, warm, fair price, quick service) and then into measurable requirements (3 mm crust, moisture under 45%, 35°C, €1.30 or less, 1 min 30 or less)

VOC – Voice of the Customer

The Voice of the Customer (VOC) encompasses all customer expectations, needs, pain points, or preferences, expressed in various ways (verbal or behavioral). The VOC makes it possible to start from an actual need, rather than an intuition, and translate it into Critical Customer Requirements (CCR): measurable criteria that can be directly applied in production.
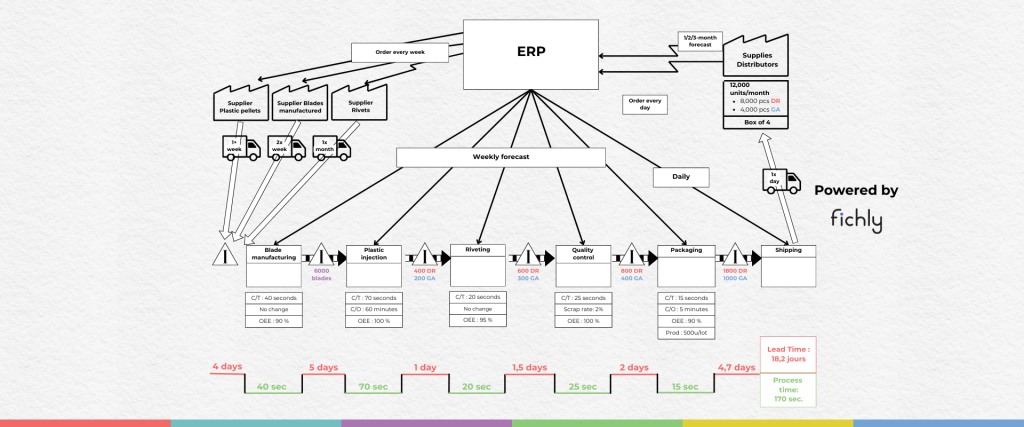
Value stream map of a scissors production line driven by an ERP system, from three suppliers through blade manufacturing, plastic injection, riveting, quality control, packaging and shipping, with cycle times, inventories and a timeline showing 18.2 days of lead time for 170 seconds of process time

VSM

Value Stream Mapping (VSM), or value chain mapping, is a visual tool used to analyze and design the flow of materials and information required to deliver a product or service to the customer. It helps identify inefficiencies, bottlenecks, and waste in processes in order to improve overall performance, while also providing a better understanding of the process and of VA/NVA (Value-Added / Non-Value-Added).
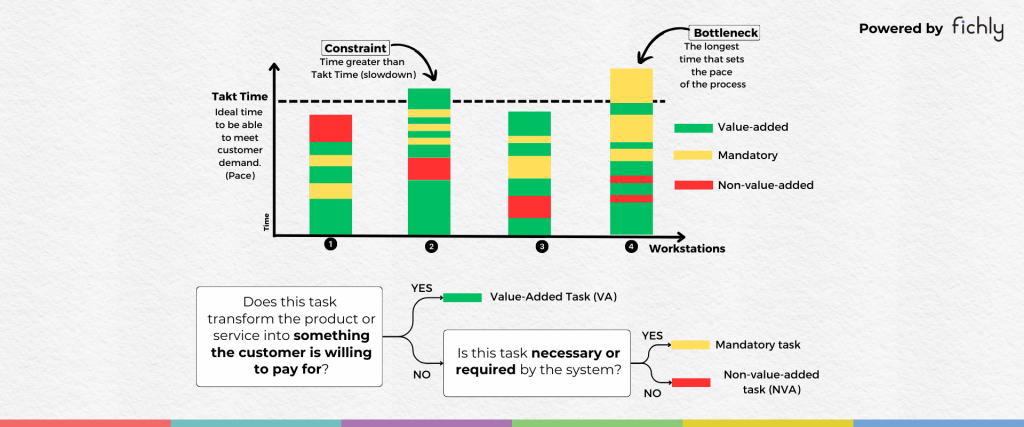
Yamazumi chart of four workstations as stacked bars (value-added in green, required in yellow, non-value-added in red) compared with the takt time line, with station 2 flagged as a constraint and station 4 as the bottleneck, plus a decision tree to classify each task

Yamazumi

This diagram is a visual representation used to balance workloads. It shows the tasks to be performed and their distribution among operators/workstations. It helps improve cycle time by identifying VA/NVA. The objective is to optimize the use of resources and eliminate bottlenecks.
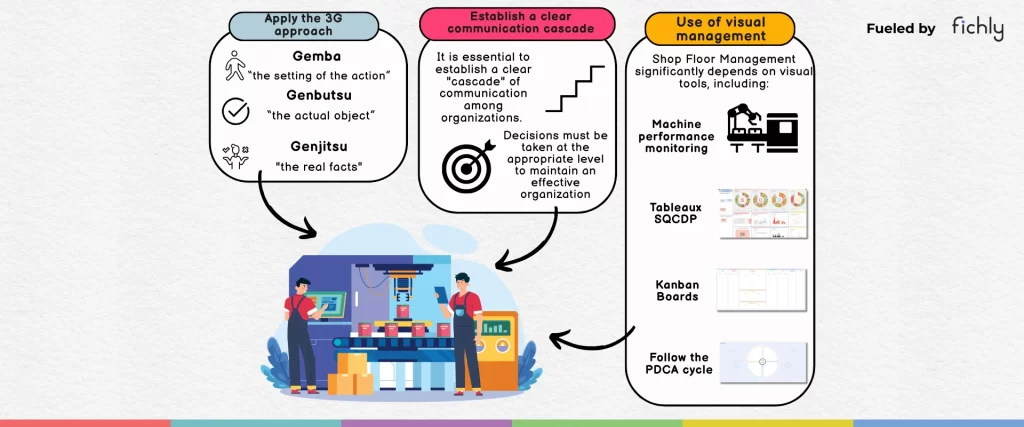
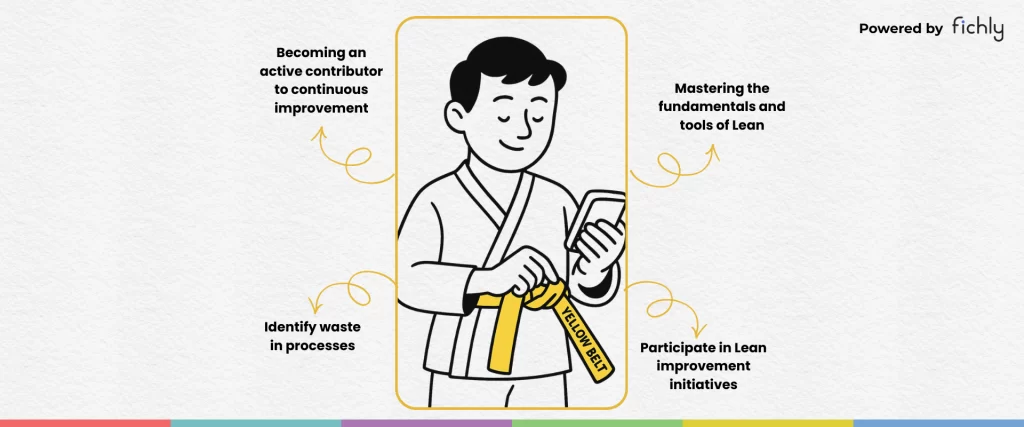
Illustration of a Lean Six Sigma Yellow Belt in a martial arts uniform with four key responsibilities: becoming an active contributor to continuous improvement, mastering the fundamentals and tools of Lean, identifying waste in processes, and participating in Lean improvement initiatives
Yellow Belt

The Yellow Belt corresponds to the operational level of Lean. Yellow Belts are able to identify waste, use simple improvement tools (5S, SIPOC, brainstorming, etc.) and actively participate in improvement projects. They also contribute to performance monitoring, for example through visual indicators such as SQCDP.
Get started
Stop working in silos. Put iObeya at the centre of your manufacturing stack.
Bring your MES, ERP and BI. We’ll show you how their data runs as one live visual management layer.