


- Home
- Lean Corner
- How to Build Visual Management That Can Be Read in 31 Seconds
How to Build Visual Management That Can Be Read in 31 Seconds
A board covered in indicators, charts and sticky notes in every colour. The team huddle takes place in front of it every morning. And yet, ask someone from outside the team whether everything is fine today, and they stand in front of the board with no idea what to answer. The board exists, but it does not speak. Successful visual management can be recognised by one thing: it is understood without explanation. Here is how to build it.
The Board Supports the Routine, It Is Not Decoration
A visual management board has no value in itself. It serves the routine held in front of it: the team huddle, the area meeting, the management review. Its role is to let a group see the same situation at the same moment, understand what is happening and decide what to do.
In The High Velocity Edge , Steven Spear identifies what makes certain companies, Toyota first among them, structurally faster than their competitors. The first lever is building visual management that reveals problems as soon as they appear. Not a month later, in the monthly review. The same day, in front of the team that can act.
That is why a board is judged by what it triggers, not by how it looks. A polished board that leads to no decision is a display. A sheet of cardboard drawn in marker that gets the team reacting every morning is a management tool.
Co-Build the Board With the People Who Use It
The most common reflex is to have the board designed by the methods office or the continuous improvement team, then installed on the shop floor. The result is predictable: a clean, complete board that the team fills in out of obligation.
The opposite approach works much better. The team draws its own board, first in marker on a large sheet of cardboard. It tests it for a few days in real conditions, corrects it, redraws it. Three versions in one week is not a failure, it is the normal process: draft, prototype, validation. The board is only produced in its final form once the team has put it to the test.
What changes is ownership. When an operator says “this is our board, not the methods office’s”, the board has won. These are tools in service of the people doing the work, not in service of managers. Visual management is collective work, not a deliverable handed to a team.
A Common Structure: See, Understand, Act
Co-building does not mean every team invents its own logic. A common structure lets anyone read any board in the company.
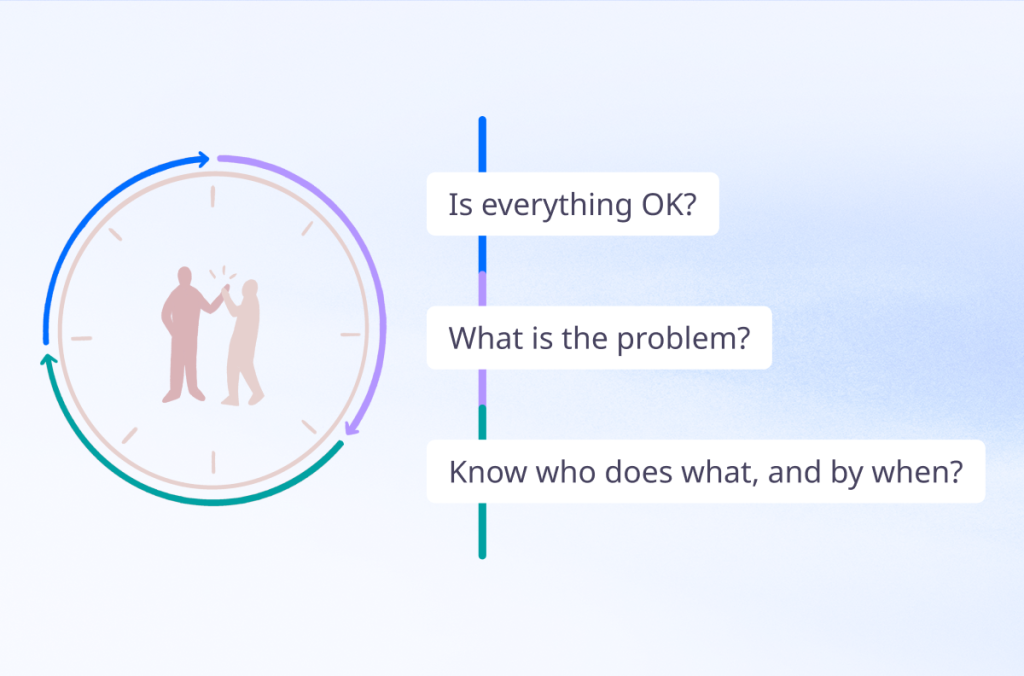
The board is organised in columns: the voice of the customer (VOC), then Safety, Quality, Cost, Delivery, People (SQCDP). Every column follows the same three-step logic.
See : the indicator and the gap to target.
Understand and anticipate: what slowed us down yesterday, what could block us today?
Act: actions in progress, escalations, who does what and by when.
This progression avoids two common drifts. A board that stops at See observes without ever dealing with anything. A board that jumps straight to Act piles up actions without understanding the causes. The three steps form a loop: acting improves understanding, which sharpens what we choose to see.
Make the Gap Visible at a Glance
An indicator only makes sense against a reference. For each indicator, display the nominal value or target next to the measured reality. The space between the two is the gap. And that gap is what the team works on, not the raw number.
Day to day, the rule is binary: target met, green cell; gap, red cell. No orange, no shades. Multiply colours and symbols and the board becomes a color chart nobody knows what each code means anymore. Red or green, OK or not OK. If it is red, the team is working on it, and that must be visible as soon as you walk in.
One simple format makes this principle very effective: the letter calendar. Each day of the month is a cell, and the cells form the large letter of the column: S, Q, C, D or P. Every morning, the team colors the day’s cell green or red. The marker takes ten seconds. At the end of the month, the letter summarises the period and can be read from ten meters away: at a glance, you see whether gaps are rare, whether they cluster in one week, or whether they come back every Monday.
Choose the Right Visual for Each Message
The letter calendar shows whether the target is met. It does not tell the whole story. To understand, you sometimes need to add a chart, provided you choose the one that serves the message:
- Bar charts compare categories: defects by workstation, delays by customer.
- Line charts track change over time and show a trend before it becomes a problem.
- Pie charts show each category’s share of a whole.
- Radar charts compare several criteria at once, such as a team’s versatility. Treemaps visualise a hierarchy and the weight of each subgroup.
- Pictograms make a proportion speak, such as people present versus people required.
The question is not “which chart looks best?” but “what does the team need to understand by looking at it?”. One chart per message. A chart that needs a verbal explanation has no place on the board